








Detecting Tillage Practices from Space: A New Approach to Monitoring Conservation Agriculture in the US Midwest
From 2014 to 2023, the Environmental Quality Incentives Program (EQIP) invested a total of $133.7 million in no-till and reduce till practices, out of a total of $10 billion in conservation financial assistance. Tillage practices are a critical component of natural resource challenges like soil erosion, and the consequences of erosion (farmdoc daily, March 14, 2024; March 21, 2024). Tracking practice adoption across millions of acres is a monumental challenge. A research team at the University of Illinois Urbana-Champaign has recently contributed to the understanding of this practice by developing a satellite-based framework for detecting tillage practices across large areas and over long time periods using satellite data (University of Illinois Urbana-Champaign, ACES News, April 21, 2026). This article briefly describes the approach and uses the resulting data to examine patterns and trends in tillage practices across the U.S. Midwest from 2000 to 2022.
Background
Tillage plays an important role in shaping soil conditions, affecting erosion risk, water retention, and long-term soil health. Tillage practices are generally grouped into three categories based on how much the soil is disturbed and how much crop residue remains on the surface. Conventional tillage involves intensive soil disturbance and leaves the surface largely bare. Reduced tillage retains some residue while disturbing the soil less. No-till avoids primary soil disturbance and keeps the most residue on the surface. Both no-till and reduced-till are considered conservation practices, as they help protect soil from erosion and improve moisture retention relative to conventional tillage (see Fig. 1).
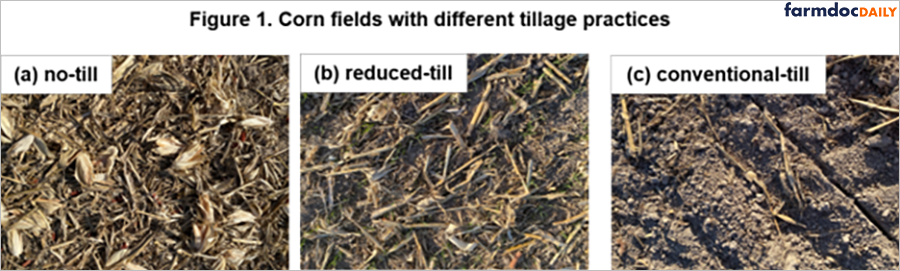
Despite its importance, it has been difficult to observe how tillage practices vary across space and over time. Existing data sources, such as the USDA Census of Agriculture, provide useful information but are reported at coarse spatial scales and only updated every five years. This makes it difficult to track year-to-year changes or to compare patterns across regions. To improve our ability to understand the extent of tillage practices, the recently published research uses satellite observations together with environmental information to generate annual estimates of tillage practices across the Midwest since 2000 (Wu et al., 2026). That research is also a great example of the potential for applying research to policy design challenges and is discussed in this article.
Discussion
One way to observe tillage practices and differences in the fields at large scale is through satellite data. Specifically, those fields with more crop residue and those with exposed (or bare) soil reflect light differently. The differences in reflected light should make it possible to distinguish the practices in fields from space.
(1) How Does the Framework Work?
After harvest and before the next crop emerges, tillage practices leave different proportions of crop residue and exposed soil on the field surface. No-till fields generally retain the most crop residue, reduced-till fields have an intermediate level of residue cover, while conventionally tilled fields expose the largest proportion of bare soil. Because crop residue and exposed soil have different reflectances, changes in their relative proportions produce measurable differences in satellite observations that can be used to estimate crop residue fraction on the ground and thus distinguish tillage intensity. The researchers use NASA’s MODIS satellite observations on a daily basis at 500-meter resolution, from which they derive the Broadband Angle Index (BAI) using red, near-infrared, and shortwave-infrared bands to represent this signal (see Fig. 2(a)). Under similar crop and environmental conditions, more intensive tillage exposes a larger fraction of bare soil, while no-till fields retain more crop residue. These differences in surface conditions are reflected in BAI values, with conventionally tilled fields generally showing higher BAI than no-till fields (see Fig. 2(b)).
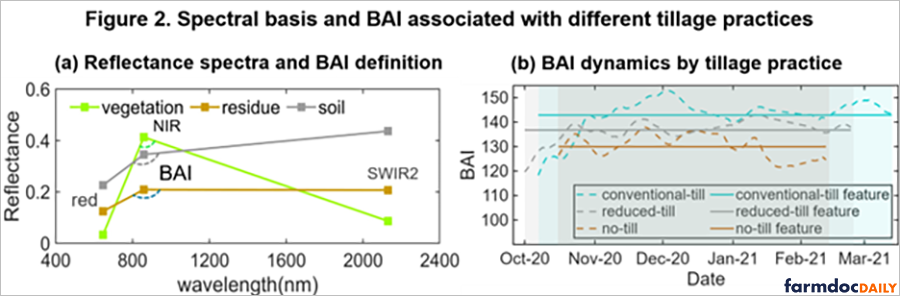
However, BAI values are influenced not only by tillage practices but also by local soil and weather conditions. A field in northern Iowa with high soil organic carbon reflects differently from a field in Kansas with sandy, low-carbon soils, even under similar management. To address this, the researchers developed a dynamic threshold model that estimates classification cutoffs separately for each county and each year, using local soil properties and seasonal weather conditions as inputs. The model was trained on a combined reference dataset drawn from NASS Census data, farmer survey data (Lu et al., 2022), and USDA ERS surveys, covering corn and soybean fields from 2000 to 2017, with 2018–2022 used for independent validation.
(2) How Accurate Is It?
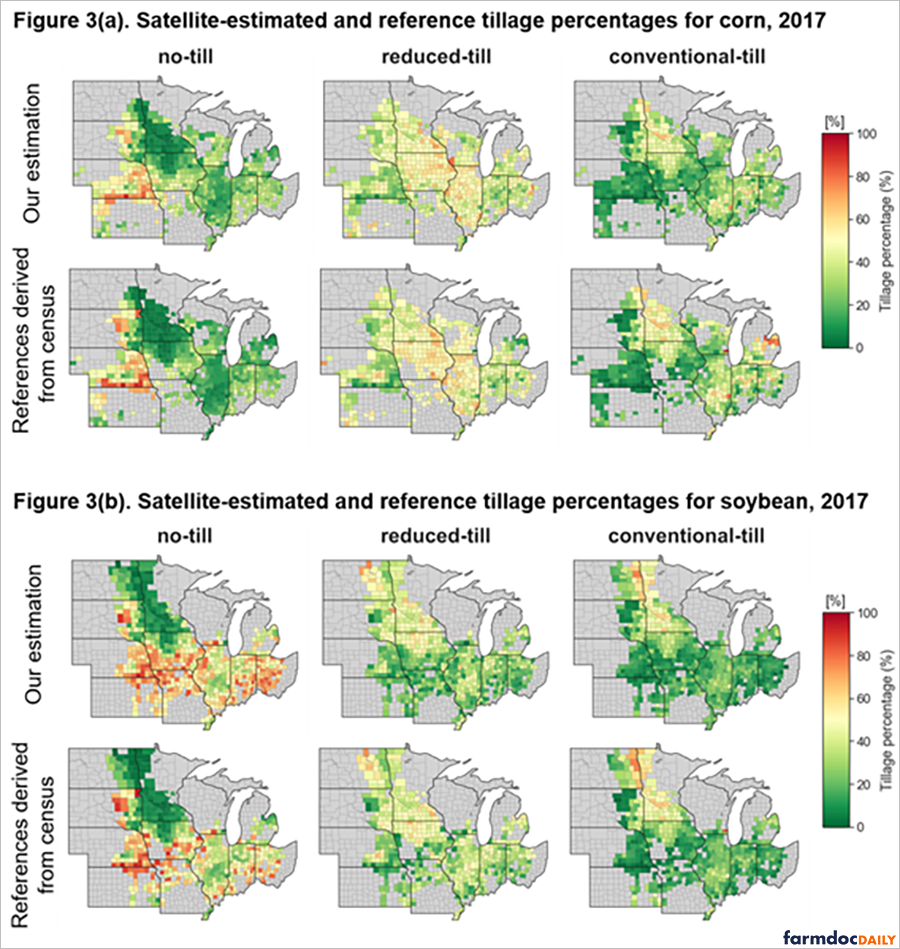
Validation against county-level reference data shows that the framework captures the main patterns of tillage practices across both crops and regions. Figure 3 provides an example for 2017, comparing the satellite estimates with the reference data for corn and soybean. The agreement varies among tillage practices. No-till shows the strongest agreement with the reference data, with the framework explaining 84% of the variation in county-level percentages for both corn and soybean. Conventional tillage also performs relatively well, while reduced tillage is more difficult to distinguish because it represents an intermediate level of soil disturbance and residue cover.
(3) Where Is Conservation Tillage Most Common?
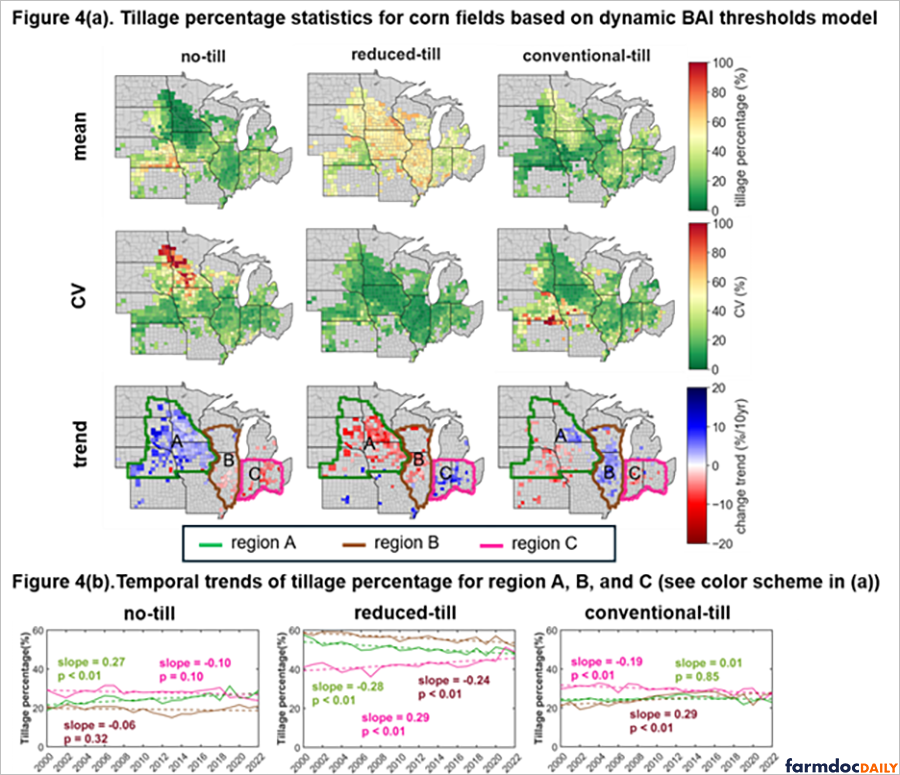
Tillage patterns vary considerably across the Midwest, both by crop and by region (see Fig. 4 & 5). Figure 4 illustrates the results for corn, finding that reduced tillage is the most common practice across much of the region. No-till for corn is more prevalent in the drier western areas, including Kansas and Nebraska, where retaining soil moisture is a primary management concern. In parts of the northern Midwest, conventional tillage remains more common, often because farmers rely on tillage to warm soils more quickly in spring for timely planting.
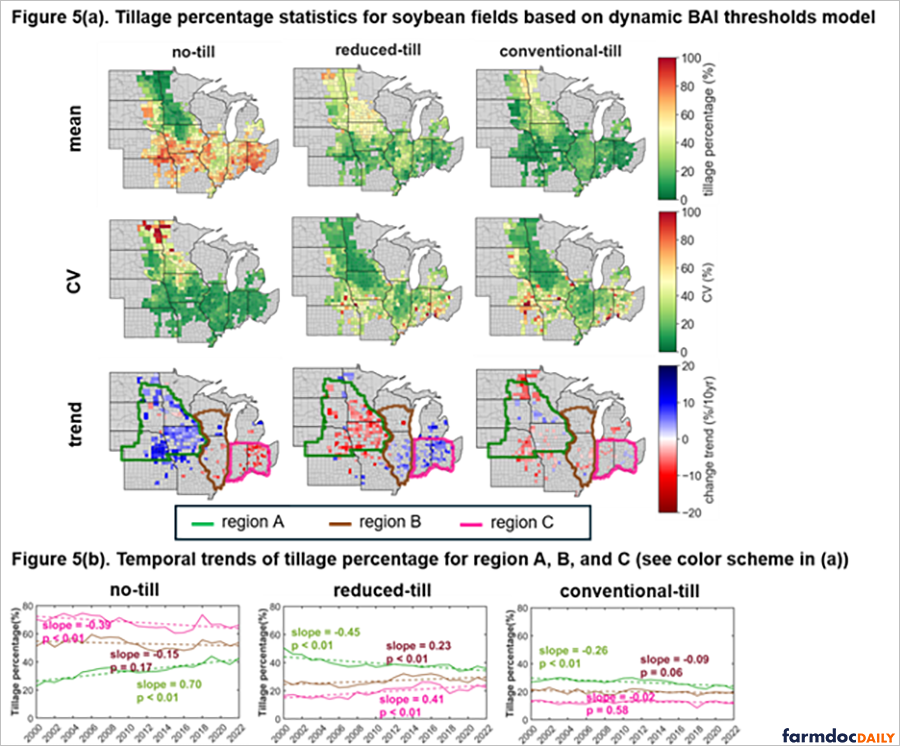
Soybean fields generally show higher no-till adoption than corn fields (see Fig.5). This likely reflects the later planting timing of soybeans, which reduces the need for tillage to speed up soil warming. No-till is particularly widespread in the warmer southern portions of the Midwest, while reduced tillage is more common in the north. These patterns are broadly consistent with what earlier survey-based studies have found, but the satellite data provide a more spatially continuous and annually resolved view across the full region.
(4) How Have Tillage Practices Changed Over Time?
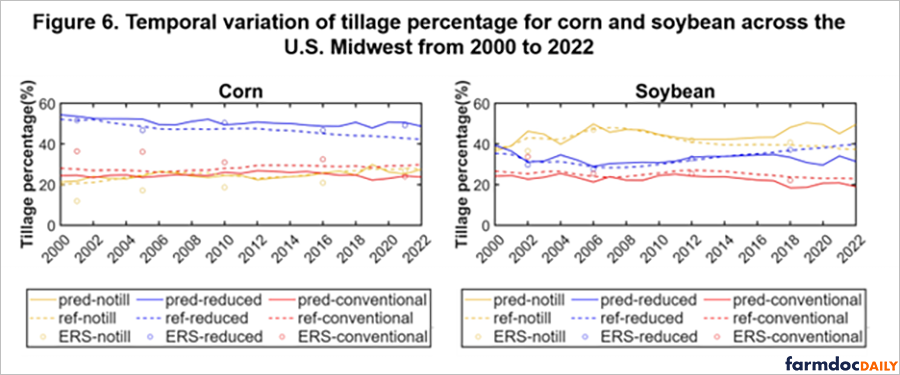
Across the Midwest as a whole, the data show a gradual shift toward conservation tillage over the 23-year period, though the pace of change is modest (see Fig. 6). For corn, no-till has slowly expanded while reduced tillage has declined at a similar rate, suggesting that some fields have transitioned from reduced tillage to no-till rather than toward conventional tillage. Conventional tillage for corn shows little net change at the regional scale. For soybeans, the trend is somewhat clearer: no-till has increased over time alongside a decline in conventional tillage, pointing to a gradual move toward less intensive management in soybean systems.
The county-level maps also show that these changes are not uniform across the landscape (see Fig. 4&5). In the eastern part of the Great Plains, Iowa, and southwestern Minnesota, no-till has increased steadily for both corn and soybean systems, largely replacing reduced tillage. This pattern is consistent with the importance of conserving soil moisture in drier environments. In contrast, parts of the central Midwest, including Illinois and Michigan, show a different trajectory. In corn systems, conventional tillage has increased while reduced tillage has declined. In soybean systems, the trend is less pronounced but generally shifts toward greater use of reduced tillage. Further east, in states such as Indiana and Ohio, reduced tillage has expanded in corn systems, often replacing conventional tillage. In soybean fields, changes tend to reflect a shift away from no-till toward reduced tillage.
(5) Connecting Tillage Trends to Conservation Investment
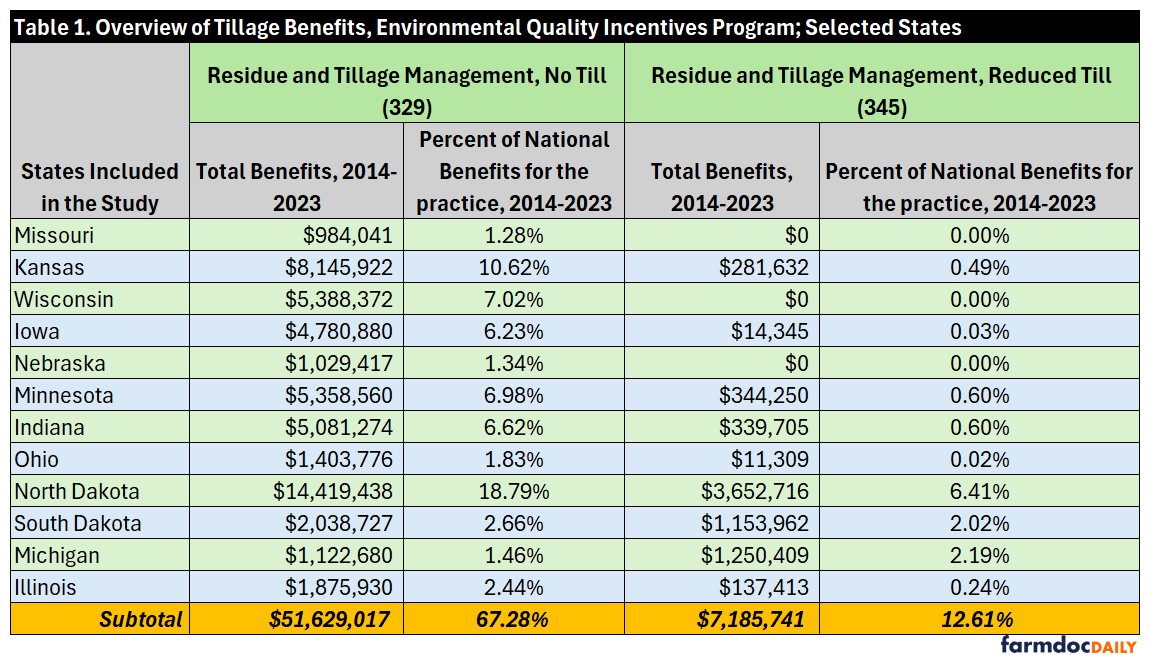
The spatial tillage data provide a way to connect observed management trends with conservation program investment. Earlier research has documented that EQIP and CSP financial assistance for soil erosion practices is distributed unevenly across counties, and that areas with documented erosion risk do not always receive proportional investment (farmdoc daily, April 10, 2025; February 13, 2025). Table 1 summarizes the data for the two primary tillage practices that receive financial assistance from EQIP. The table provides the financial benefit totals for the years 2014 to 2023, for the States in the study, as well as the percentage of the national totals for those practices. All data in the table was downloaded from the Policy Design Lab (https://policydesignlab.ncsa.illinois.edu/eqip).
Annual tillage maps can add spatial specificity to that picture — identifying not just where conservation practice adoption is low, but whether it is trending up or down over time. Used alongside existing data on conservation funding and crop insurance liabilities, this kind of information could help improve the program. For example, national administrators could direct resources toward counties where tillage intensity has remained high or where conservation trends are moving in the wrong direction. Given limited funding, moreover, an understanding of how far short the assistance falls compared to a measure of need could help improve conservation investments by Congress. The 23-year record here provides a starting point for that kind of analysis.
Concluding Thoughts
The satellite-based framework discussed here produces annual, county-level estimates of tillage practices across the US Midwest — filling a monitoring gap that five-year census data cannot address. The dynamic threshold approach, which adapts to local soil and weather conditions rather than applying fixed cutoffs, offers a meaningful improvement over existing methods and provides a more stable and accurate picture of tillage trends over time.
The 23-year record shows gradual but uneven progress toward conservation tillage. Trends are generally positive, particularly for soybeans and in drier western regions, but the pace of change is slow and varies considerably across the landscape. For conservation policies, like EQIP, annual tillage maps offer a more responsive and spatially detailed tool for tracking where conservation practices are expanding, where adoption remains low, and where program investments may be most needed. Applying advanced research, such as that discussed herein, could help advance policy designs and improve critical conservation investments.
References
Coppess, J. Conservation Quandaries, Part 1: Too Much and Not Enough. farmdoc daily (15):28, University of Illinois at Urbana-Champaign, February 13, 2025. https://farmdocdaily.illinois.edu/2025/02/conservation-quandaries-part-1-too-much-and-not-enough.html.
Coppess, J., Das, A., Xu, Y., Li, Q., Shuai, S., Wang, S., Zhou, Q., Peng, B., Boparai, K., and Guan, K. Research & Conservation: Reviewing the Illinois Dust Storm of 2023. farmdoc daily (15):67, University of Illinois at Urbana-Champaign, April 10, 2025. https://farmdocdaily.illinois.edu/2025/04/research-conservation-reviewing-the-illinois-dust-storm-of-2023.html.
Lu, C., Yu, Z., Hennessy, D. A., Feng, H., Tian, H., and Hui, D. Emerging weed resistance increases tillage intensity and greenhouse gas emissions in the US corn-soybean cropping system. Nature Food 3 (2022): 266-274. https://doi.org/10.1038/s43016-022-00488-w.
Ruppert, S., J. Coppess, W. Fathauer and M. Skidmore. "A Menace to National Welfare Reconsidered, Part 1: Reviewing the Costs of Erosion." farmdoc daily (14):52, Department of Agricultural and Consumer Economics, University of Illinois at Urbana-Champaign, March 14, 2024.
Ruppert, S., J. Coppess and M. Skidmore. "A Menace to National Welfare Reconsidered, Part 2: Reviewing Tillage." farmdoc daily (14):57, Department of Agricultural and Consumer Economics, University of Illinois at Urbana-Champaign, March 21, 2024.
University of Illinois College of Agricultural, Consumer and Environmental Sciences. University of Illinois researchers develop dynamic framework to monitor tillage practices from space. News release, 2026. https://aces.illinois.edu/news/university-illinois-researchers-develop-dynamic-framework-monitor-tillage-practices-space
Wu, X., Zhou Q., Guan, K., Wang, S., Hipple, J., Peng, B., Chen, Z., and Qin, R. A framework to detect tillage practices from space: A demonstration in the US Midwest. Remote Sensing of Environment (2026): 115323. https://doi.org/10.1016/j.rse.2026.115323.
Disclaimer: We request all readers, electronic media and others follow our citation guidelines when re-posting articles from farmdoc daily. Guidelines are available here. The farmdoc daily website falls under University of Illinois copyright and intellectual property rights. For a detailed statement, please see the University of Illinois Copyright Information and Policies here.