








Enough Room for the Harvest? Grain Storage Pressure in the Corn Belt
Does the US have enough space to store what’s coming off the field in this year’s harvest? Grain storage capacity must accommodate this year’s production plus existing inventories carried in from the previous crop year. Concerns about a storage crunch were everywhere in 2025 when the US harvested a record corn crop (Ehmke and Noyes, 2025). Last week in its Quarterly Grain Stocks report, the National Agricultural Statistics Service estimated September 1 corn inventories at nearly 2.1 billion bushels, almost 200 million bushels above analysts’ pre-report expectations. Though it appears this year’s crop will be slightly smaller than initially thought, storage capacity, grain stocks, and production are distributed unevenly across the country and there may still be a grain storage crunch in specific locations.
To understand the pressure that the harvest period exerts on the US grain handling and transportation system, we compare demand for grain storage with storage capacity for states in the Corn Belt. We construct a measure of storage pressure based on September 1 stocks, expected production, and existing storage capacity. The United States has in aggregate enough capacity to store this year’s carry-in stocks and the entire expected fall crop harvest. However, carry-in stocks plus production, which we term the ‘potential demand’ for storage, exceed capacity in most Corn Belt states. This means the grain handling and transportation system may be vulnerable to disruption in some instances.
Harvest-time storage pressure means the grain handling and transportation system must use or move grain quickly enough to relieve the capacity constraint. Ideally, it does so without heavy reliance on temporary storage and significant decreases in local crop prices (i.e., weak basis). We examine how quickly states have historically relieved grain storage pressure between September and December and find the system is generally capable of doing so. Based on current production expectations, there is unlikely to be a storage crunch in 2026. However, reduced investment in new storage capacity (Janzen, 2026) suggests the system is being pushed harder than in the past. A future bumper crop may require severe market conditions – large differences between source and destination prices – to balance the supply and demand for grain storage space.
State-Level Storage Capacity and the Potential Demand for Storage
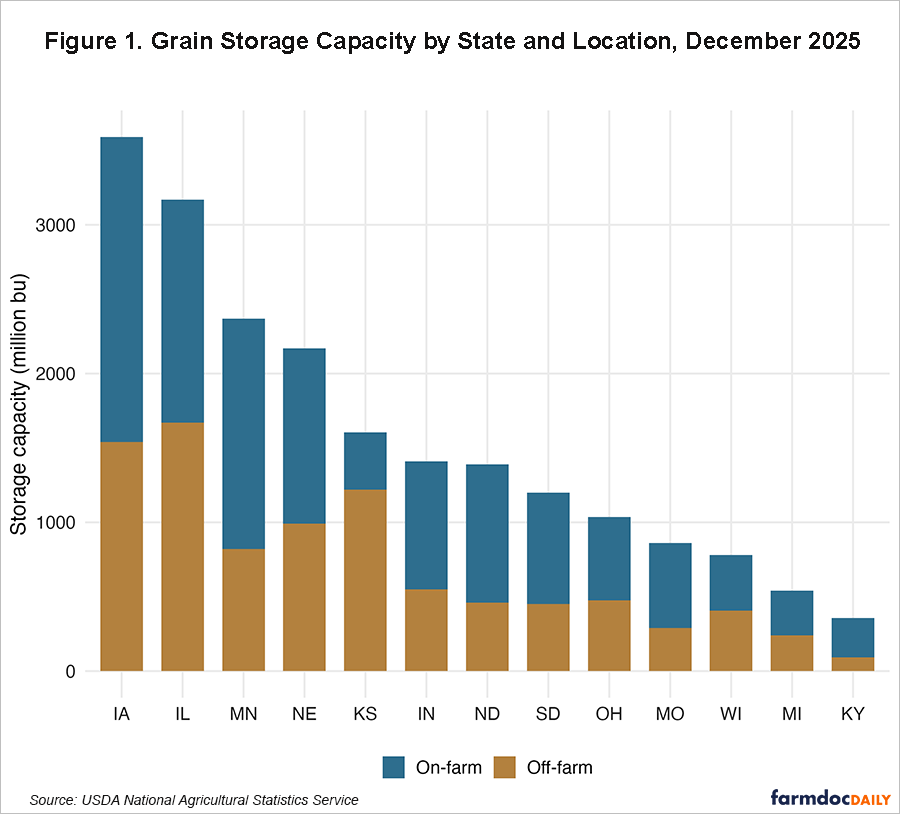
The most recent available estimates peg US grain storage capacity at 25.1 billion bushels, with on-farm facilities accounting for about 53% of the total and off-farm facilities accounting for the remaining 47%. Storage capacity is generally located near grain production, especially in areas that produce corn. Corn is by volume the biggest component of US grain and oilseed production and is the greatest user of grain storage capacity. Figure 1 breaks down total storage capacity for thirteen states in the Corn Belt. Iowa has the most storage capacity followed by Illinois, consistent with these states being the two largest producers of corn and soybeans.
Capacity alone, however, does not tell us whether there is enough room to accommodate the incoming harvest. The more important question is how much grain is already in storage and how much additional grain will need to be accommodated as the new crop comes in. We define the potential demand for grain storage as the sum of pre-harvest stocks of all grains on September 1 and projected corn, soybean, and sorghum production, since these are the major crops harvested during this period. Data come from the most recent USDA Quarterly Grain Stocks and Crop Production reports. We define storage pressure as the potential demand divided by total storage capacity, most recently estimated as of December 1, 2025.
Storage pressure of 100% means that pre-harvest stocks and the incoming crop together would completely fill existing storage capacity. Values above 100% imply the combined volume exceeds total storage capacity, so that usage or movement is necessary to accommodate the excess. In practice, grain is continuously moving through the supply chain as harvest progresses with domestic processors and export channels pulling grain away from production locations. Thus, storage pressure above 100% does not imply that capacity is exceeded, only that demand for storage capacity is greater, assuming the ability to use and move grain is unchanged.
Figure 2 shows storage pressure in 2026. The expected production component of the potential demand for storage is decomposed into a part consistent with each state’s trend yield and a part attributable to production being above or below trend. Green segments identify additional storage pressure in states where forecasted production is above trend. Dashed red outlines show lower storage pressure in places with production shortfalls.
In aggregate, the United States has enough storage capacity to accommodate the entire 2026 fall harvest, as shown in the top bar of Figure 2. September grain stocks combined with forecasted 2026 corn, soybean, and sorghum production account for about 99% of total US storage capacity. Potential demand for grain storage capacity is slightly lower than would be expected if crop yields in 2026 were in line with long-run trends.
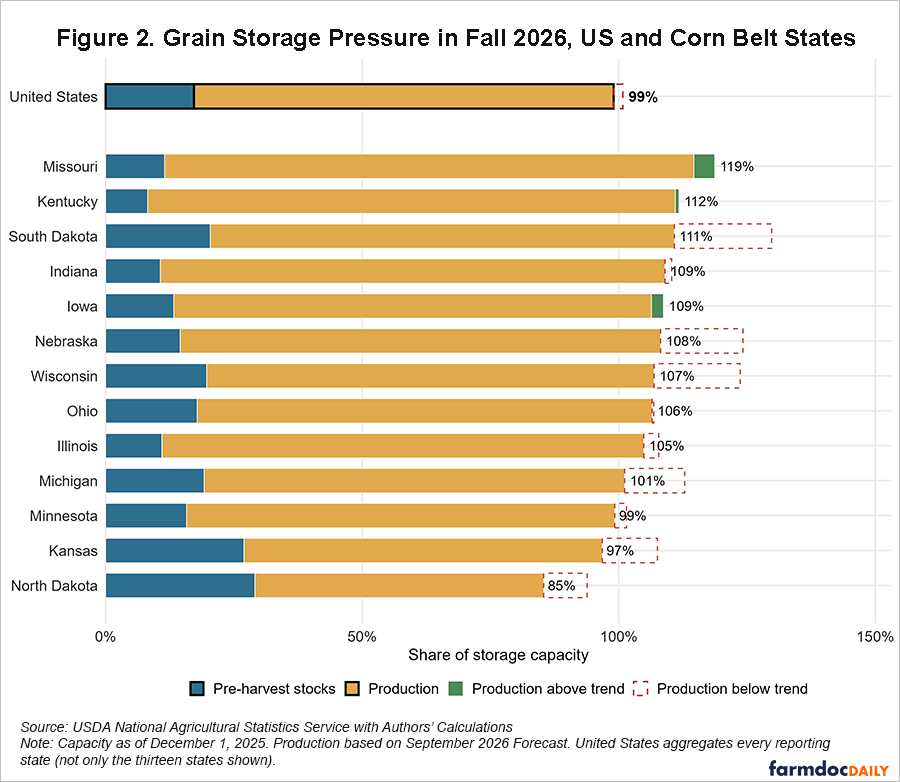
At the state level, only three of the thirteen Corn Belt states shown remain below the 100% threshold when September stocks and the entire forecasted harvest are compared with existing storage capacity. Storage pressure ranges from about 85% to 119% across these states. Missouri faces the highest storage pressure, followed by Kentucky, South Dakota, Indiana, Iowa, Nebraska, Wisconsin, Ohio, Illinois, and Michigan, all of which exceed the 100% threshold.
Many of these states would face much greater storage pressure if crop yields this year were equal to or above trend. Figure 2 shows the storage crunch in some states, notably South Dakota, Nebraska, Wisconsin, and Michigan, has been trimmed by lower-than-expected crop production. More generally, storage pressure for 2026 is less than in 2025, when large corn acreage generated a record US corn crop. The perfect storm for US grain storage capacity is a combination of plantings skewed toward corn, high yields, and some constraint on transportation. In that scenario, local crop prices would fall dramatically, and large farmer losses would result.
Storage pressure in Minnesota, Kansas, and North Dakota remains below 100%, indicating greater ability to accommodate the incoming fall harvest. States with lower storage pressure tend to be large wheat producers. Storage capacity utilization in these states tends to be smoother over time because the wheat harvest has time to move before the same storage space is used for corn, soybeans, and sorghum.
How Quickly Do States Relieve Storage Pressure?
The harvest-time storage pressure shown in Figure 2 represents the maximum amount of grain to be accommodated during harvest. As discussed above, high storage pressure does not necessarily translate into a storage shortage because grain is continuously moving through supply chains to domestic and foreign end users as the new crop comes in. Locations facing high harvest-time storage pressure may be able to manage relatively easily, with limited impacts on local prices, if grain moves quickly. The same level of storage pressure would be more consequential if grain cannot be moved or used.
To further examine the vulnerability to a potential storage crunch, we compare each state’s fall storage pressure with its post-harvest storage capacity utilization. We calculate state-level capacity utilization as the level of grain stocks on December 1 divided by grain storage capacity in that year. The difference between storage pressure and capacity utilization provides a simple measure of how much storage pressure is relieved during the three months of the fall harvest period.
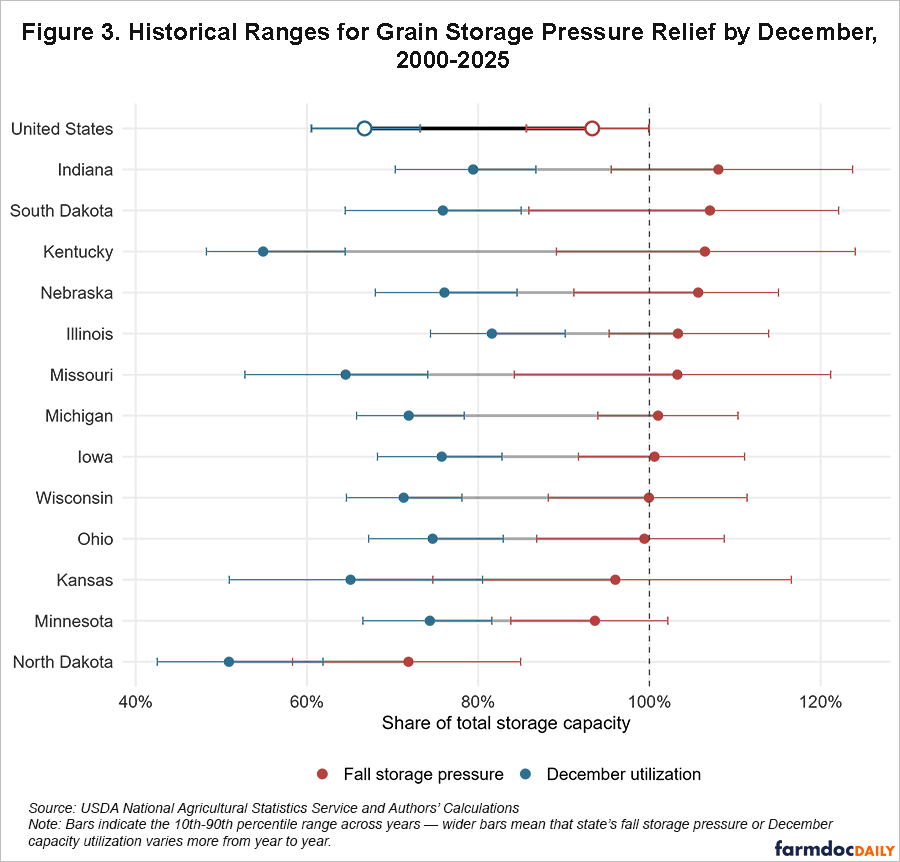
Historical experience suggests storage pressure is relieved by December 1. Figure 3 visualizes the difference between fall storage pressure and capacity utilization after harvest. Nationally, potential demand for storage generally does not exceed capacity. Grain movement and use relieve storage pressure by an average of 27 percentage points, so that post-harvest national average storage capacity utilization is about two-thirds. Even in years where storage pressure was high, such as 2018 and 2025, national grain storage capacity utilization was only about 75% on December 1.
State-level figures suggest the storage crunch is more acute in specific geographies, especially in the Corn Belt. Figure 3 sorts states by their average fall storage pressure level (given by the red dots) in the 2000-2025 period. Bars indicate the range of past outcomes as given by the 10th and 90th percentiles of the historical distribution. Figure 3 also plots the average December 1 storage capacity utilization (given by the blue dots) with similar bars showing the distribution of past outcomes. Many states have fall storage pressure that typically exceeds 100%. However, all states show significant relief in storage pressure; by December 1, all Corn Belt states have storage capacity utilization below 100% and average capacity utilization across states in this period is around 70%.
Illinois stands out because it combines relatively limited pressure relief with a high starting point; the drop between fall storage pressure and December capacity utilization is about 22 percentage points. Minnesota and North Dakota also show small declines of about 19 and 21 percentage points, respectively, but each begins with lower September storage pressure. As a result, even modest relief leaves storage utilization at more moderate levels by December. Illinois, by comparison, averages 103% storage pressure in September and relieves only about 22 percentage points, leaving December utilization at 81%, the highest among the thirteen states.
Other states, for example Kentucky and Missouri, are generally able to relieve much more storage pressure between September and December, with average declines of about 51 and 38 percentage points, respectively. These differences may matter when typical grain movements are disrupted. States such as Illinois, where storage pressure tends to remain relatively high through December, may have less room to accommodate additional delays in grain movement. States such as Kentucky and Missouri could face a different exposure if their relatively rapid pressure relief depends in part on transportation channels that become constrained. If low water on the Mississippi River, for example, restricts barge capacity and slows grain movement, the disruption could cause storage pressure to persist and market conditions to deteriorate; states where storage pressure is high and the typical drawdown is small or restricted may be vulnerable to these shocks.
Discussion
Grain storage is the grease in the wheels of the grain handling and transportation system. The availability of storage enables efficient movement of grain to end users. Harvest puts pressure on storage infrastructure because the demand for storage is greatest at that time. Our analysis measures pressure by assessing where potential demand exceeds storage capacity. It shows that national storage capacity alone provides an incomplete picture of storage conditions during harvest; production and storage capacity are not perfectly co-located so storage pressure is greater in specific locations and in specific years. At the national level, September grain stocks and forecasted 2026 corn, soybean, and sorghum production are projected to be about 99% of total storage capacity. Yet storage pressure in 2026 exceeds 100% in ten of the thirteen Corn Belt states, illustrating how the national aggregate can mask considerably tighter conditions at the local level.
Storage pressure above 100% does not mean that a state will run out of grain storage. It only suggests that the potential demand for storage is greater. Efficient grain movement and usage typically relieve storage pressure. Situations of relatively high storage pressure, where our measure is around 120%, can readily be relieved by normal operation of the grain handling and transportation system: most states reduce storage pressure by 20 percentage points or more, even under challenging conditions.
What is potentially more concerning is that storage pressure has been rising over time. Crop yields and production continue to grow in the long run and storage capacity increases have not kept pace in the past five years (Janzen, 2026). Thus, storage capacity utilization is increasing. In 2026, concerns about a storage capacity crunch are somewhat muted compared to a year ago when the US harvested a record corn crop (Ehmke and Noyes, 2025). Even so, storage pressure this year is near the upper end of the historical range both nationally and in most Corn Belt states (outcomes in Figure 2 are near the high end of ranges shown in Figure 3). Therefore, we also anticipate December 1 storage capacity utilization to be historically high. Monitoring storage pressure and capacity utilization is important for assessing where storage capacity constraints may emerge in the future. If we see a year with some combination of above-average production, big acreage, large carry-in stocks, and constraints on grain movement, lower prices and weaker basis will be the result.
References
Ehmke, T. and Noyes, E. (2025). Grain logistics outlook: Record crop meets trade uncertainty. CoBank Knowledge Exchange. https://www.cobank.com/knowledge-exchange/grain-logistics-outlook-record-crop-meets-trade-uncertainty
Janzen, J. (2026) "US Grain Storage Capacity Growth Has Stopped." farmdoc daily (16):20, Department of Agricultural and Consumer Economics, University of Illinois at Urbana-Champaign, February 9, 2026.
Disclaimer: We request all readers, electronic media and others follow our citation guidelines when re-posting articles from farmdoc daily. Guidelines are available here. The farmdoc daily website falls under University of Illinois copyright and intellectual property rights. For a detailed statement, please see the University of Illinois Copyright Information and Policies here.