








Under Pressure: The Size and Timing of the Harvest Low in Corn Basis
Corn harvest has started in Illinois. On Monday, September 14, the USDA National Agricultural Statistics Service estimated corn harvest in the state was already 8% complete in its weekly Crop Progress report. As combines roll across the US Corn Belt, commodity market analysis often attributes any observed decrease in crop prices to the phenomenon of ‘harvest pressure’. Abundant supply at harvest means farmers are willing sellers and grain buyers less aggressive bidders in the market for immediate delivery. Basis, the price difference between the local spot and nearby futures prices, weakens as new-crop corn fills bins and country elevators, then recovers as harvest pressure eases.
To corroborate the harvest pressure phenomenon, we study seasonal corn basis patterns for 136 elevators across twelve Corn Belt states from 2010 to 2025. For the harvest period, we describe when basis bottoms, how far it falls, and where this happens. By comparing seasonal basis patterns with estimated harvest progress, we examine the timing connection between the seasonal basis dip and harvest pressure.
The Corn Belt average basis bottoms in the same week as the typical midway point of harvest when we might expect harvest pressure is greatest. Across all years in our sample, the average size of the dip is about 11 cents per bushel. However, this average masks greater seasonal basis variation in specific locations. Because harvest itself moves with geography, the bottom arrives at different weeks in different places, and its depth varies as well. The Corn Belt average basis decline smooths out local decreases; for example, the median harvest basis decline is 16 cents on average and 19 cents per bushel in Illinois. Bigger harvest basis lows tend to be concentrated in the center of the Corn Belt, especially in areas that accumulate corn supplies from a wider area, such as those near river transport.
Seasonal Patterns in Harvest-Time Basis
In grain markets, basis is simply a way of expressing a given price in a format convenient for grain elevators and other firms who engage in commercial hedging. While basis may be negative or positive, it is important to recognize that basis variation is the same as variation in local prices, because basis values are calculated against a common benchmark price. Higher values are referred to as a ‘stronger’ basis and lower values a ‘weaker’ basis.
This article documents seasonal corn basis weakness during the fall harvest period. Previous farmdoc daily articles have documented the long-run returns to storing grain past this period of basis weakness and farmer marketing tendencies in the post-harvest period (e.g., Zulauf, October 8, 2025; Janzen, December 8, 2023). Basis values are the spot price at a given location minus the price of the new-crop December futures contract. We consistently observe basis bids against the December contract for the period from early September to late November (just prior to the expiration of the December futures contract when basis bids for corn roll to the March contract). Our data come from Geograin via the Bloomberg Terminal.
To uncover the typical seasonal basis pattern, we measure the state-level average basis in a given week relative to the observed state basis level at the end of November. This abstracts away from changes in price and basis levels across years that may confound measurement of the average or typical seasonal pattern. Because of this normalization, our results are not skewed by years where basis was abnormally strong or weak.
Figure 1 traces the shape of the seasonal pattern in harvest basis averaged across twelve Corn Belt states over the past sixteen years. Basis typically falls through the month of September, bottoms in October, and rises in November. The harvest low occurs in mid-October when the basis level is about 11 cents per bushel below the end-of-November baseline. The bottom is broad rather than sharp. The curve stays within three cents of its trough for about five weeks, roughly through the month of October, before beginning to recover.
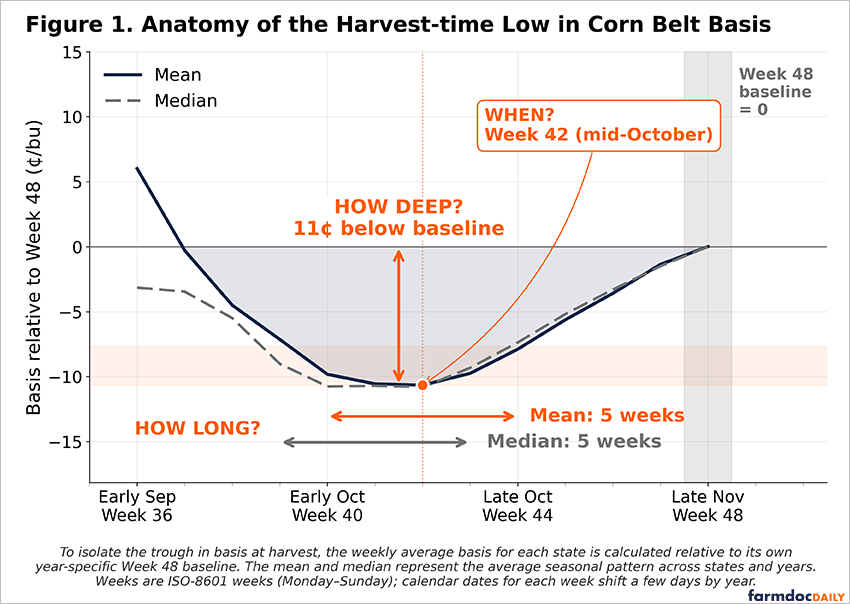
Basis patterns at both the mean and median are shown in Figure 1. The trough pattern that bottoms in mid-October is present in both and the basis low occurs in both measures in the same week. Comparing the mean and median suggests the seasonal basis pattern is not skewed by outlier values, except perhaps in early September. This is likely a case of local prices (basis the December futures) reflecting much higher old-crop values before new-crop supplies are truly available to the market in a small number of years.
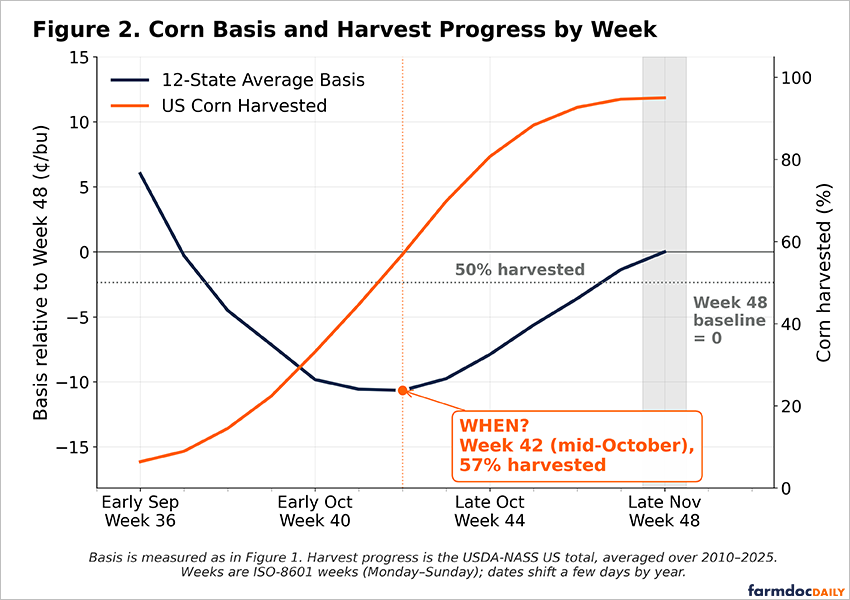
Figure 2 plots the aggregate basis pattern against weekly estimates of harvest progress produced by the USDA National Agricultural Statistics Service. The two series move together through the fall. Basis weakens as combines roll and harvest progress speeds up. Basis reaches its low in the same week the crop crosses 50% harvested. Between weeks 41 and 42 (in mid-October) about 12% of the US corn crop is typically harvested. Basis only begins to significantly recover as harvest passes about three-quarters complete. Figure 2 strongly suggests basis weakness tracks the availability or supply of grain to the market, what market watchers refer to as harvest pressure.
Is Harvest Pressure a Local Phenomenon?
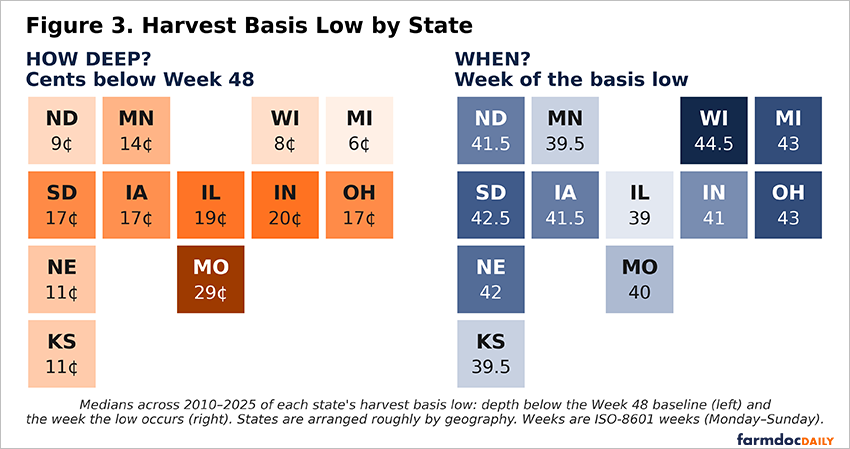
The aggregate 11-cent harvest pressure effect understates the harvest low at a given location, because different places bottom in different weeks and averaging flattens the low. Measured at each state’s own trough, the mean decline is just over 16 cents per bushel and the median decline is just under 15 cents per bushel. The depth also varies year to year. The largest state-average harvest basis low in our sample was about 50 cents and these large basis lows tend to occur earlier in the harvest period. There are also state-years where the basis low is zero (where the weakest basis is observed at the end of harvest in late-November).
The depth and timing of the harvest basis low has a geography. Figure 3 maps the median depth and timing by state. Basis falls furthest in the central and eastern Corn Belt, where Missouri, Indiana, and Illinois show median declines of roughly 19 to 29 cents per bushel, and least in the northern lake states of Michigan and Wisconsin, at 6 to 8 cents. The broad pattern is deeper harvest weakness at locations close to river transport and closest to main flow of corn to end-users. This is consistent with harvest pressure being greatest when corn supply most exceeds local demand and storage capacity. There is less basis weakness where smaller production and/or nearby livestock and processing demand keep harvest pressure in check.
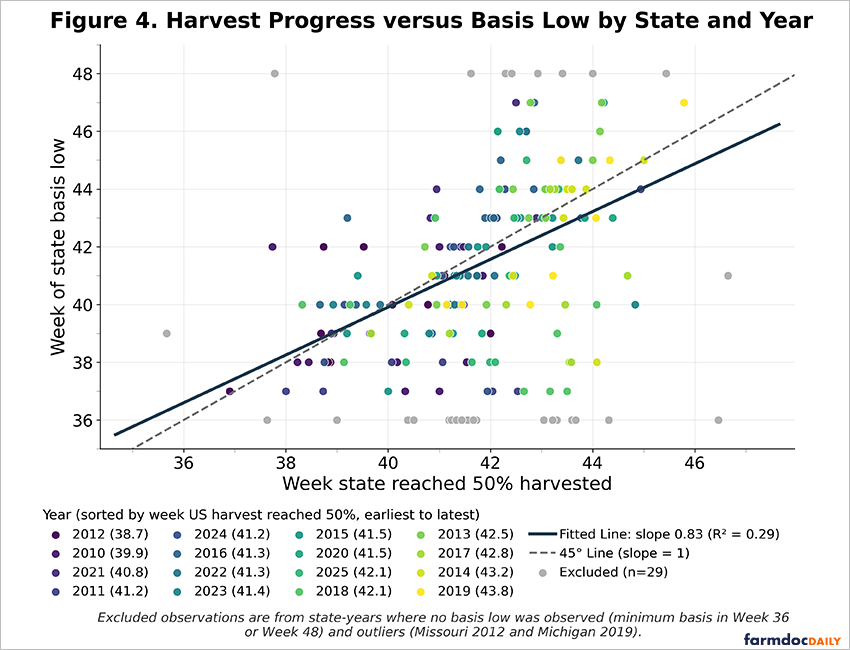
The local harvest basis low also tends to coincide with the point in time where harvest progress is most rapid. Figure 4 plots state-year harvest pressure (measured as the week where the state reached 50% harvested) against the timing of the basis low. The dashed 45-degree line indicates points where the basis low coincides with the greatest harvest pressure. The solid regression fitted through these data excluding outlier points where no basis trough was observed is statistically similar in slope to the 45-degree line.
However, the relationship between local harvest pressure and seasonal dip in basis is imperfect. The fitted line explains only 29% of the variation in the timing of the basis low. Much of the difference between state-specific harvest pressure and the basis low appears related to given years. Darker dots in Figure 4 indicate state-years where aggregate US harvest progress was quicker than usual. Lighter dots indicate slower harvest years. Darker dots tend to be concentrated in the lower left of figure 4 and lighter dots in the upper right. This suggests that faster overall harvest pressure can result in the harvest low occurring earlier in a given state, even if harvest progress is relatively slow there.
Implications
The practical weight of these results lies in what harvest-time selling costs. In Illinois, selling corn across the scale at the seasonal low gives up about 19 cents per bushel in weaker basis on average relative to the same location weeks later. In years with especially weak basis, the cost can range from 30 to 50 cents per bushel. At the current 2026 estimate of 209 bushel/acre yield for Illinois, 19 cents per bushel is nearly $40 per acre, so the foregone revenue from selling at the harvest low matters for farm profitability. However, weekly fluctuations in the corn futures price are typically around 10 cents in single week and about 40 cents, up or down, during the harvest. A grower’s price received is the futures price plus basis; gains made by avoiding sales at the harvest low may be swamped by counteracting moves in the futures price.
This article provides a starting point for estimating the gains from avoiding sales across the scale. It suggests the bushels that must move at harvest are more expensive: any ability to defer delivery past a local market’s basis trough, even by a few weeks, captures the steepest part of the recovery, especially if one hedges the futures component of the price. However, these gains must be weighed against the potential costs. Many farmers may find additional handling, delayed harvest activity, and other associated costs outweigh the gains. That said, geography plays a role. Growers in the central and eastern Corn Belt face the deepest harvest lows and have the most to gain from bridging harvest, while on the periphery of the Corn Belt, avoiding the harvest basis low is less likely to result in net gains.
Data Note
Daily corn basis is taken from Geograin cash-grain series available on the Bloomberg Terminal, computed as the posted cash bid minus the nearby CME corn futures price, for 136 facilities across twelve states — Iowa, Illinois, Indiana, Kansas, Michigan, Minnesota, Missouri, North Dakota, Nebraska, Ohio, South Dakota, and Wisconsin — over 2010 through 2025. The panel begins from 219 tickerized facilities; those missing more than 10% of daily basis observations and two states with only a single location were dropped, leaving 136. Locations in these data tend to be larger facilities like processing plants and river elevators, but the data include all types of facilities.
Because Geograin quotes basis against a nearby futures reference that rolls forward through the fall (September to December to the next-year March contract), a naïve series mixes contracts and lets the weaker March basis distort the late-season weeks. For our analysis, we therefore keep only the December-referenced observations — those whose implied futures price (cash bid minus basis) reconstructs the CME December futures price, identified using the nearby and second-nearby futures — and measure depth against the Week-48 (late-November) level, the last week with full December coverage. Harvest-progress data are weekly state estimates from USDA-NASS; the 50%-harvest week is interpolated between the two straddling weekly reports. One state-year, North Dakota 2019, is excluded from the harvest-pace comparison because that crop was left standing over winter and did not reach 50% harvested until spring 2020.
References
Janzen, J. "Post-Harvest Grain Marketing: How Important Is It?" farmdoc daily (13):223, Department of Agricultural and Consumer Economics, University of Illinois at Urbana-Champaign, December 8, 2023.
Zulauf, C. "Net Return to Storing US Corn and Soybeans Since 1973." farmdoc daily (15):185, Department of Agricultural and Consumer Economics, University of Illinois at Urbana-Champaign, October 8, 2025.
Bloomberg L.P. “GeoGrain Cash-Grain Basis Indices and CME Corn Futures Prices (Nearby and Second-Nearby): Settlement Data, 2010–2025.” Bloomberg Terminal. https://professional.bloomberg.com/products/bloomberg-terminal/
Disclaimer: We request all readers, electronic media and others follow our citation guidelines when re-posting articles from farmdoc daily. Guidelines are available here. The farmdoc daily website falls under University of Illinois copyright and intellectual property rights. For a detailed statement, please see the University of Illinois Copyright Information and Policies here.