








Illinois Farm Financial Trends in 2025: Summary and Analysis
Farm incomes in 2025 were higher than in 2024, resulting in slightly stronger average financial position for Illinois farms (see farmdoc daily article from September 18, 2026). The Farm Financial Standards Council has identified several key measures to analyze the financial strength of a farm business. These measures are in the areas of liquidity, solvency, profitability, and financial efficiency. The averages for these key measures for 2,018 Illinois farms enrolled in Illinois Farm Business Farm Management (FBFM) can be found in Table 1. These measures are also calculated by farm type. Due to the effects that weather and other outside factors may have on a farm business for any one year, it is better to monitor these measures over time and to identify trends than it is to rely too heavily on these measures for any one year when making business decisions. More detailed and in-depth analysis of these financial characteristics can be found in Financial Characteristics of Illinois Farms, published by FBFM and the Department of Agricultural and Consumer Economics at the University of Illinois.
The dataset includes 2,018 farms, with grain farms making up the large majority (1,942 farms). Smaller groups include 12 hog farms, 27 dairy farms, and 38 beef farms. This context is important because averages are heavily influenced by the dominance of grain farms.
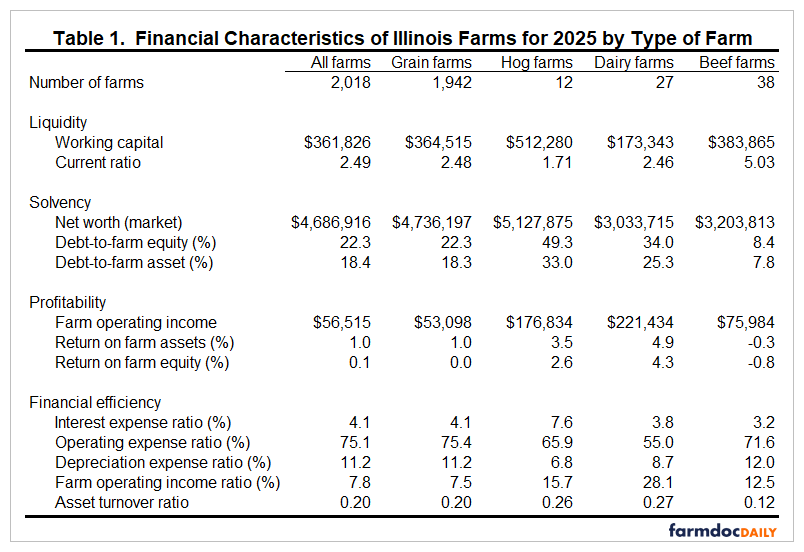
Liquidity is an assessment of a farm’s ability to meet current cash-flow needs. The amount of working capital and the current ratio (current assets divided by current liabilities) are two measures of liquidity. The average amount of working capital as of December 31 for the 2,018 farms was $361,826 down less than one percent from $364,504 a year earlier. Hog farms had the greatest working capital, averaging $512,280, while dairy farms had the least, averaging $173,343. Most assets on a dairy farm—such as the herd, buildings, and land are classified as noncurrent. The average current ratio for all the farms was 2.49, up from 2.46 a year ago. Beef farms recorded the highest (most healthy) current ratio, and hog farms the lowest. The current ratio for 2022 was the highest on recent record at 3.52, which was about 29% higher than in 2025.
Solvency is a measure of the farm’s overall financial strength and risk-taking ability. The average net worth of the 2,018 farms at the end of 2025 was $4,686,916, up from $4,472,445 the year before. Average accrual farm and non-farm incomes in 2025 were above family living requirements allowing the average net worth to increase, also driven by higher land values. Hog farms had the highest net worth, followed by grain farms, with dairy farms recording the lowest. The debt-to-farm equity and debt-to-farm asset indicators show how debt capital is combined with equity capital. This is useful in looking at the risk exposure of the business. The average debt-to-farm asset percentage for all farms was 18.4. The debt-to-farm asset percentage ranged from 7.8 for beef farms to 33.0 for hog farms. The average debt-to-farm asset level of 17.8 from 2022 was at its lowest level for at least 20 years.
A measure of a farm’s profitability is useful in examining its ability to meet family living demands and retire term debt. It is also useful in measuring the farm’s ability to utilize assets and equity to generate income. The average return on farm assets for the 2,018 farms averaged 1.0 percent, compared with -0.5 percent in 2024. Dairy farms recorded the highest returns, averaging 4.9 percent, while beef farms recorded the lowest, averaging -0.3 percent. Return on farm equity in 2025 ranged from -0.8 percent for beef farms to 4.3 percent for dairy farms. The average was 0.1 percent, up from -1.7 percent in 2024.
Farm operating income is another important measure of profitability. In 2025, the average across all farms was $56,515. Grain farms showed the lowest values, while dairy farms averaged operating income of $221,434. These values illustrate the higher income year livestock farms on average experienced, especially dairy farms due to the much higher price of dairy bull calves.
The interest, operating, and depreciation expense ratios relate to these various expense categories as a percentage of the value of farm production. The farm operating income ratio measures the return to labor, capital, and management as a percentage of the value of farm production. These measures can be used to evaluate the financial efficiency of the farm business. The interest expense ratio averaged 4.1 percent for the 2,018 farms, ranging from the highest at 7.6 percent for hog farms to 3.2 percent for beef farms. 4.1 percent was down from 4.2 percent in 2024. The farm operating income ratio ranged from a high of 28.1 percent for dairy farms to 7.5 percent for grain farms. The average for all farms in 2025 was 7.8 percent, up from -0.8 percent in 2025. From 2021 through 2025, the five-year average farm operating income ratio was 15.2 percent. The 2025 farm operating income ratio for all farms was below the five-year average.
The depreciation expense ratio, averaging 11.2 percent across all farms, indicates the share of production value consumed by capital asset wear. Grain farms were near the average, while hog farms were lower at 6.8 percent. This reflects differences in machinery and facility investments between farm types.
The asset turnover ratio measures how effectively farm assets are used to generate income. The 2025 average was 0.20, with dairy farms showing higher turnover (0.27) compared to beef farms (0.12). This suggests that dairy and hog operations generally utilized assets more intensively than beef-focused operations.
The financial results on all Illinois farms show that on average 2025 was a slightly stronger financial year on average due to higher incomes. Most of the Illinois FBFM farms in this financial sort are grain farms. Grain farms had their highest income ever in 2021 and 2022, leading to build ups of cash and other assets. However, after three years of lower incomes on grain farms, working cash has decreased almost 40 percent from 2022 on the average farm to 2020 levels. With projected continued lower incomes for the rest of 2026 and 2027 (see farmdoc daily article from September 1, 2026), farmers will need to find ways to reduce costs while making efficient use of assets. Careful monitoring of these measures is essential in an environment of tighter margins to help make sound farm financial decisions for your operation.
The author would like to acknowledge that data used in this study comes from the Illinois Farm Business Farm Management (FBFM) Association. Without Illinois FBFM, information as comprehensive and accurate as this would not be available for educational purposes. FBFM, which consists of 5,000 farmers and 80 professional field staff, is a not-for-profit organization available to all farm operators in Illinois. FBFM field staff provide on-farm counsel along with recordkeeping, farm financial management, business entity planning and income tax management. For more information, please contact our office located on the campus of the University of Illinois in the Department of Agricultural and Consumer Economics at 217-333-8346 or visit the FBFM website at www.fbfm.org.
References
Zwilling, B. "2025 Illinois Farm Earnings Improve but Remain Below Recent Averages." farmdoc daily (16):168, Department of Agricultural and Consumer Economics, University of Illinois at Urbana-Champaign, September 18, 2026.
Paulson, N., G. Schnitkey, C. Zulauf and B. Zwilling. "Illinois Crop Budgets for 2027." farmdoc daily (16):157, Department of Agricultural and Consumer Economics, University of Illinois at Urbana-Champaign, September 1, 2026.
Disclaimer: We request all readers, electronic media and others follow our citation guidelines when re-posting articles from farmdoc daily. Guidelines are available here. The farmdoc daily website falls under University of Illinois copyright and intellectual property rights. For a detailed statement, please see the University of Illinois Copyright Information and Policies here.