








The Growing Role of ECO and SCO in Federal Crop Insurance Support
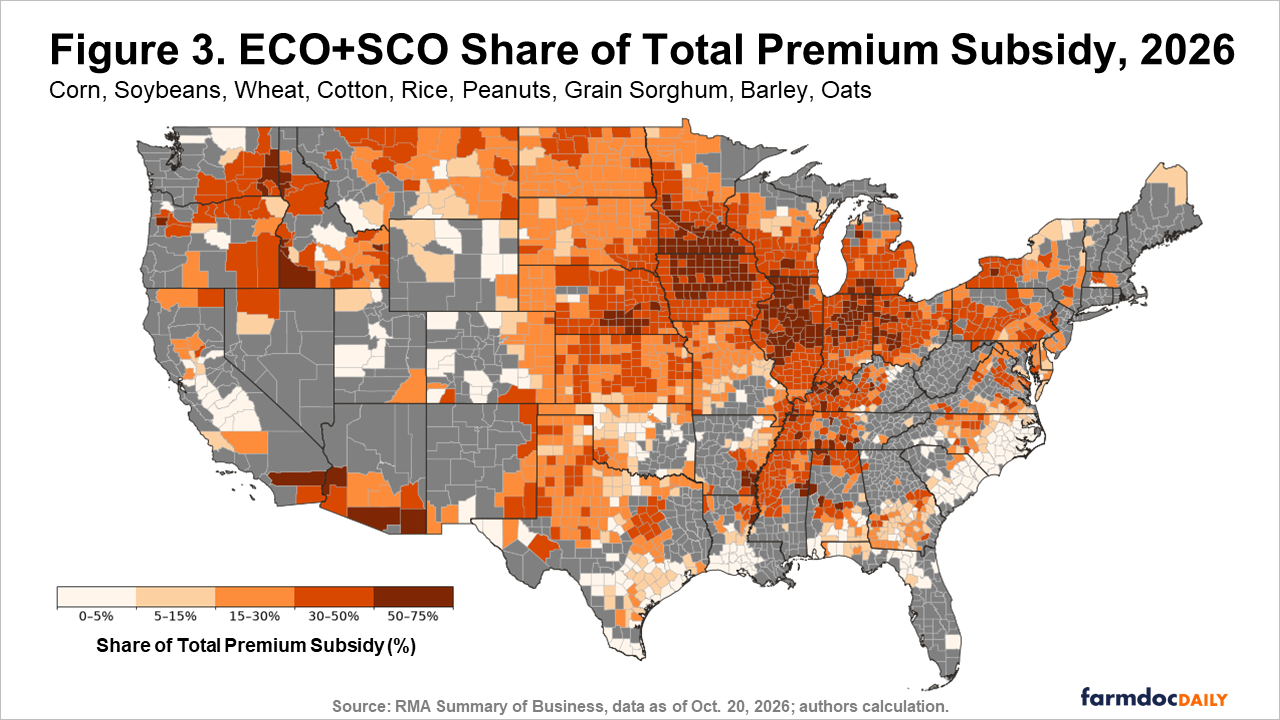
This article documents increases in premium support associated with two county add-on products: the Supplemental Coverage Option (SCO) and the Enhanced Coverage Option (ECO). Premium support is the amount of premium paid by the Federal government and is typically the largest Federal outlay associated with Federal crop insurance. Together, ECO and SCO accounted for 35% of total premium subsidies in 2026 for the nine major crops, up from 4% in 2024 and 16.7% in 2025. That percentage varies across the country, with higher values in the Midwest. Much of this increase can be associated with increases in premium subsidies in the One Big Beautiful Bill Act (see farmdoc daily, August 26, 2026). This article examines how recent subsidy increases for ECO and SCO have impacted the distribution of federal premium support across crops and regions.
The Adoption Response to Subsidy Increases
SCO and ECO are county-level products that farmers can purchase in addition to more typical farm-level products such as Revenue Protection (RP), Revenue Protection with Harvest Price Exclusion (RP-HPE), Yield Protection (YP), and actual production history (APH). Their adoption has risen due, in large part, to the increase in the percentage of premium paid by the Federal government. The One Big Beautiful Bill Act (OBBBA) increased premium support on SCO and ECO from 65% to 80%, the same subsidy rate as cotton STAX. STAX is a county-level product similar to SCO, which was instituted as a substitute for Title I programs for cotton when Title I programs were eliminated. As a result, SCO and ECO use increased. Because SCO goes down to the coverage level of the underlying farm-level product, some declines in farm-level coverage have occurred.
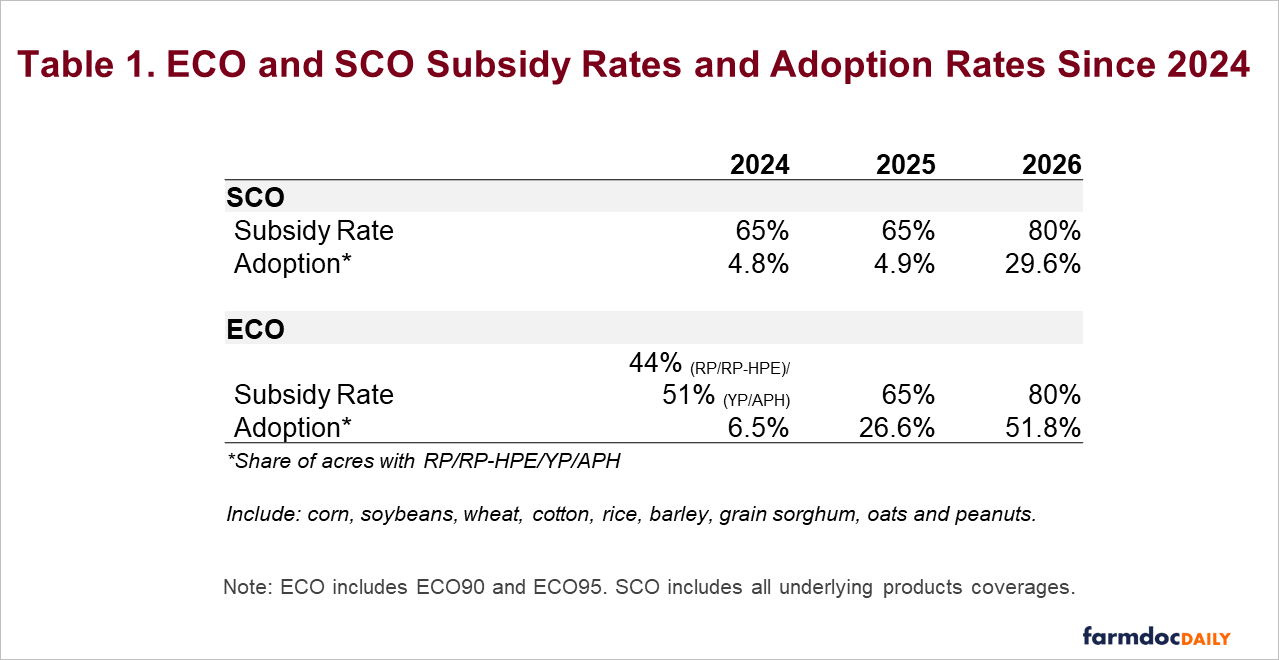
Table 1 summarizes SCO and ECO subsidy rates and adoption rates as a share of eligible acres for the past three years for nine crops that USDA calculates costs of production: Corn, soybeans, wheat, cotton, rice, grain sorghum, peanuts, barley, and oats. Eligible acres represent acres with individual farm-level products on which the county-level add-ons could be purchased. SCO had a 65% subsidy rate in 2024 and 2025, and the adoption rate was 4.8 and 4.9%. OBBBA increased the subsidy rate to 80%, and adoption rates increased to 29.6%. The Risk Management Agency (RMA) also increased the ECO subsidy rate to 65% in 2025, and following OBBBA, to 80% in 2026. Adoption responded significantly increasing from 6.5% in 2024 to 26.6% in 2025 to 51.8% in 2026 (data as of October 20). For a more in-depth discussion of the subsidy increases, see farmdoc daily of December 10, 2025.
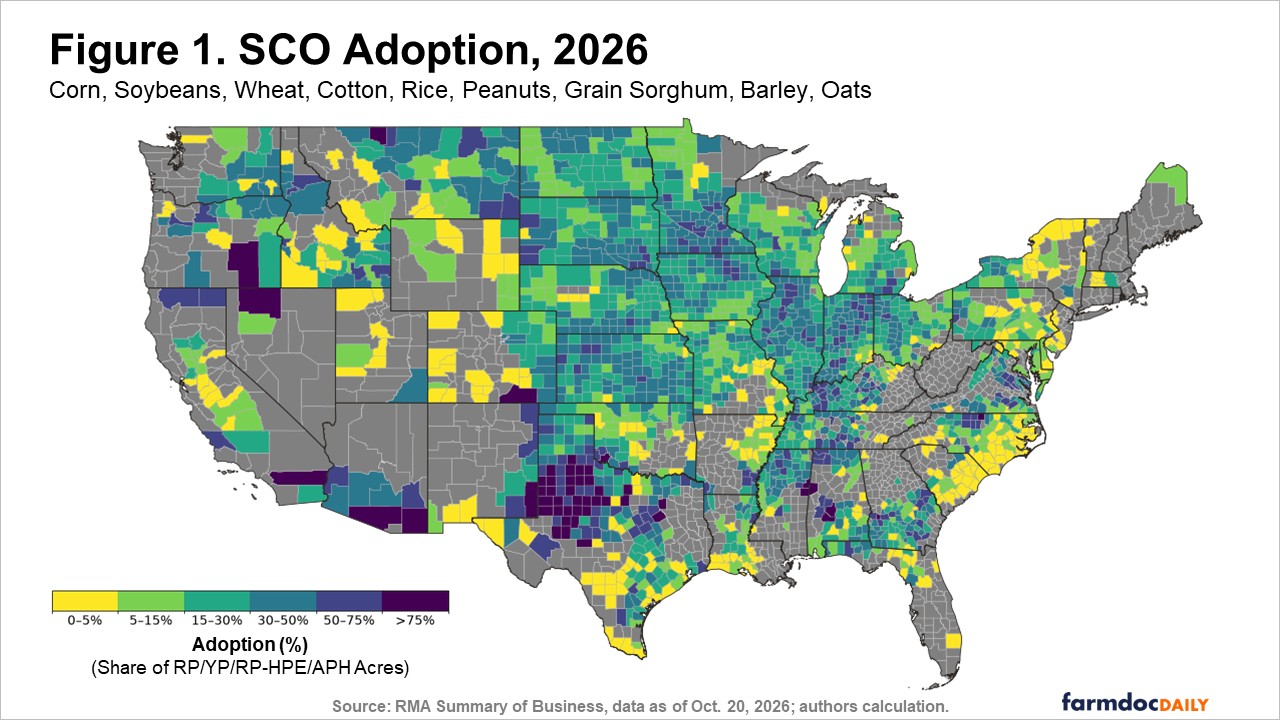
Regional adoption of SCO and ECO varied substantially. SCO adoption exceeded 50% in the Texas panhandle, driven by cotton uptake (see Figure 1). By switching to SCO rather than using cotton STAX, cotton producers became eligible for commodity title payments, a change made in the OBBBA. Farmers in the Midwest and Great Plains also increased adoption, with some counties having adoption rates ranging between 30-50%.
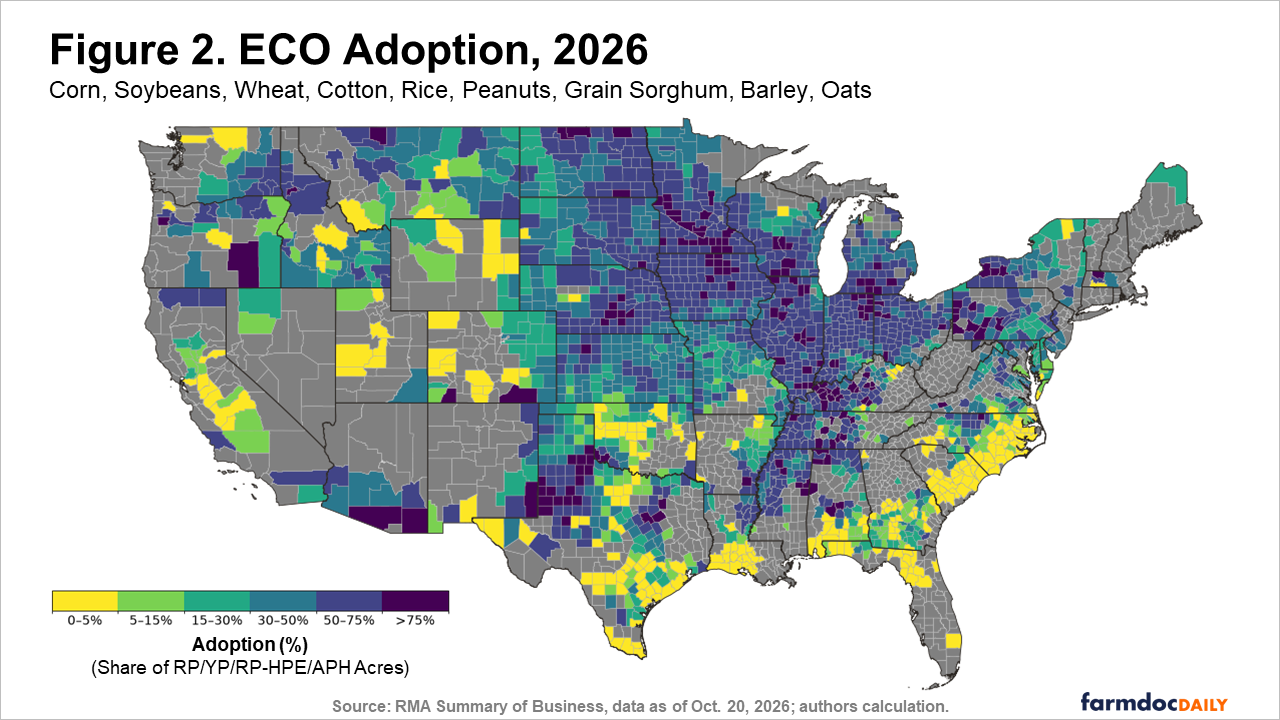
ECO adoption was widespread for corn and soybeans, as well as for wheat in the Northern Plains and cotton in Texas. ECO95 was the primary ECO coverage level and Revenue Protection (RP) was the most elected underlying coverage. In some counties, ECO was purchased for more than 75% of eligible acres.
How Much ECO Plus SCO Represented of Total Premium Support
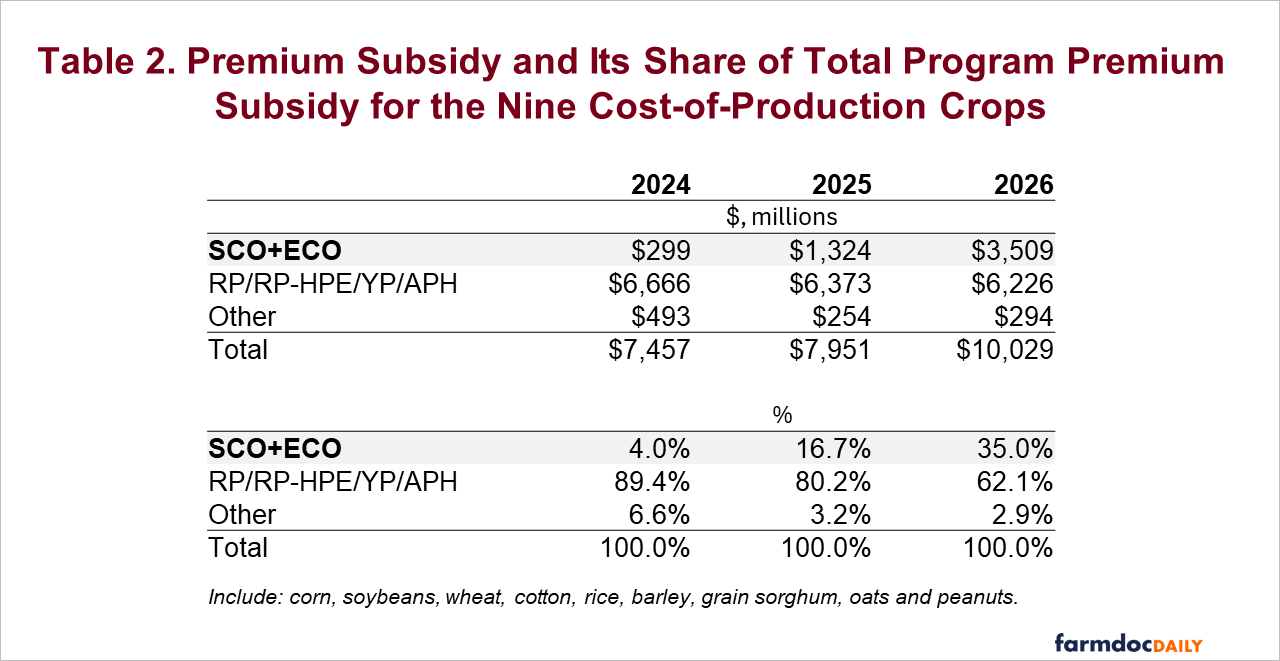
In terms of premium subsidy, SCO and ECO share of subsidy support has also increased. Table 2 shows national total ECO and SCO subsidy and its share to total program premium subsidy for the nine crops. It includes SCO and ECO at all coverage levels, and all underlying policies.
Total premium subsidy for these plans across the nine crops rose from about $7.46 billion in 2024 to $10.03 billion in 2026. SCO and ECO subsidy grew more than tenfold, from $0.3 billion to $3.5 billion, while subsidy on the underlying RP/RP-HPE/YP/APH policies declined modestly, from $6.67 billion to $6.23 billion (partially driven by changed in projected prices) to SCO plus ECO premium support as a share of total premium support rose from 4% in 2024 to 16.7% in 2025, to 35% in 2026.
Like adoption, there are significant differences at a regional level. Most of the Midwest has ECO plus SCO subsidies ranging from 30-50% of total premium subsidy. In Central and Northern Illinois, the Iowa/Minnesota border and parts of Ohio, the combined SCO and ECO share now accounts for a majority of federal premium subsidy, with subsidy as a share of total premium support ranging from 50%-75%.
Discussion
ECO and SCO have become a major share of federal crop insurance premium subsidies. For the nine cost-of-production crops, the two products together accounted for 35% of premium subsidies in 2026, up from 4% just two years earlier. In some Midwest counties, they now supply more than half of all premium subsidy. This is a fast and geographically concentrated shift in the composition of federal support.
ECO-95 led the increase in adoption across the country (Tsiboe et al., 2026 and farmdoc daily, August 26, 2026). It is a policy with a narrow band — covering county losses from 95% down to 86% — but a high likelihood of triggering, and therefore a high premium per acre. Broad uptake of a high-premium policy carrying a large subsidy quickly shifts the main channel of federal support.
A large share of subsidy, however, is not the same as a large benefit to producers. Net producer benefit is the subsidy transfer plus program performance, or net indemnities (farmdoc daily, July 28, 2026). When the loss ratio equals one, the two coincide. When it falls below one — as recent loss ratios for ECO and SCO have (farmdoc daily, July 23, 2024) — the realized benefit is lower than the subsidy. ECO especially has a short history, which limits what can yet be said about its performance. However, more than ever the rating of these products is pivotal as it sets both the support that flows to each acre and the gap between that support and what producers ultimately receive.
Additional changes will take effect for the 2027 crop year. ECO ‘s band will decline to 90% – 95%, while SCO will provide coverage from 90% down to the coverage level of the underlying policy. ECO will continue to trigger at the same level, while SCO will begin covering losses at a higher trigger level than under the current structure. All else equal, these changes are expected to reduce ECO premiums and increase SCO premiums, which may also alter participation and the relative amount of federal premium subsidy associated with each product.
Ultimately, future loss experience, participation, and the rating of these products will be important for understanding how effectively federal crop insurance support is being delivered across crops and regions.
References
Monaco, H., N. Paulson, G. Schnitkey, C. Zulauf and B. Sherrick. "Crop Insurance Loss Performance and Impacts on Farmer Net Support by Crop." farmdoc daily (16):133, Department of Agricultural and Consumer Economics, University of Illinois at Urbana-Champaign, July 28, 2026.
Schnitkey, G., B. Sherrick, C. Zulauf, N. Paulson and J. Baltz. "Performance of SCO and ECO in the Midwest." farmdoc daily (14):136, Department of Agricultural and Consumer Economics, University of Illinois at Urbana-Champaign, July 23, 2024.
Tsiboe, Francis, Monaco, Henrique , Zhao, Hongxi , Ifft, Jennifer , Chakravorty, Rwit , Turner, Dylan , & Arita, Shawn . (2026). Trends and Outlook for Supplemental Crop Insurance in the United States, 2025. Unknown. https://doi.org/10.22004/AG.ECON.412822
Zulauf, C. "Circumventing the Federal Budget Process: Crop Insurance Premium Subsidies." farmdoc daily (15):227, Department of Agricultural and Consumer Economics, University of Illinois at Urbana-Champaign, December 10, 2025.
Zulauf, C., H. Monaco, J. Coppess and G. Schnitkey. "2026 Area Add-On Insurance Purchases by US Farmers." farmdoc daily (16):153, Department of Agricultural and Consumer Economics, University of Illinois at Urbana-Champaign, August 26, 2026.
Disclaimer: We request all readers, electronic media and others follow our citation guidelines when re-posting articles from farmdoc daily. Guidelines are available here. The farmdoc daily website falls under University of Illinois copyright and intellectual property rights. For a detailed statement, please see the University of Illinois Copyright Information and Policies here.