


Understanding EPA’s 2012 RIN Rollover Estimates
One of the supporting points for the EPA’s recent decision to deny waiver requests for the renewable fuel standard (RFS) program was the availability of excess renewable identification numbers (RINs) generated in previous periods which could be used for compliance. This “RIN rollover” reduces the demand for physical biofuel to meet the RFS, and also the associated demand for biofuel feedstocks such as corn for ethanol. EPA’s estimates of the amount of RINs available for rollover into the 2013 compliance period were provided in a supporting memorandum to the docket, and fell in the range of 2.4 to 2.7 billion RINs. These estimates are well above my most recent estimate of 1.9 billion for ending 2012 ethanol RIN stocks, implying even greater potential flexibility for corn for ethanol demand in 2013.
The EPA estimates differ from those provided here on farmdoc daily for a number of reasons. First, the data used for the EPA estimates come from their Moderated Transaction System (EMTS), while I used ethanol production and trade data from the Energy Information Administration along with mandate levels outlined in the RFS. Second, and more importantly, the EPA estimates apply a different interpretation of the 20% limit on RIN rollover from the previous to the current period. The specific language on the 20% rollover limit can be found in §80.1427(a)5 of the RFS:

The language above implies that the maximum amount of previous period RINs which can be rolled over for compliance into the current period is 20% of the current period’s mandate by category. However, the EPA estimates apply the rule as a total of 20% of the total mandate across all biofuel categories can be rolled over, leaving the amounts of RIN rollover within each category flexible. As an example, the total volumetric mandate under the RFS for 2013 is 16.55 billion gallons, with 13.8 billion gallons falling in the renewable category. My RIN stock estimates assumed the 20% limit on renewable (D6) RIN rollover was 2.76 billion gallons (0.2013.8), but the EPA estimates allow for up to 3.31 billion gallons (0.2016.55) in renewable RIN rollover from 2012 to 2013, assuming zero rollover from other D-code categories (i.e. biodiesel, cellulosic, or other advanced).
The tables below provide updated RIN rollover estimates using the EMTS data as of February 20, 2013. I am focusing on biodiesel (D4), other advanced (D5), and renewable (D6) RINs. Data on cellulosic ethanol (D3) RINs is also available, but reported RIN generation has been below mandate levels in each year so it is assumed that there is no D3 RIN rollover which would impact the estimates below.
In 2011, net biodiesel RIN generation is reported at just over 1.6 billion, with 1.347 billion being used towards compliance. The biodiesel mandate for 2011 was 800 million volumetric gallons which, based on the equivalence value of 1.5 for biodiesel, would require 1.2 billion RINs. This leaves a total of 264 million D4 2011 biodiesel RINs which could have been rolled into 2012. The fact that compliance use exceeded mandate needs implies some obligated parties may have borrowed against 2011 for 2010 compliance, or some D4 RINs were used to comply with the other advanced mandate category in 2011 (note the nested structure of RINs and ability to apply certain D-codes to other mandate categories, refer to this post for more info on this).
For the other advanced (D5) category, net RIN generation was 219 million with 171 million used for 2011 compliance. The 2011 other advanced mandate was 543 million gallons. There are a number of scenarios which could explain this. Since compliance use was below net production, it could be that obligated parties had carried sufficient 2010 D5 RINs into 2011 to comply with the mandate, or that some D4 RINs were used for compliance. Regardless, the EMTS data implies potential 2011 D5 RIN rollover into 2012 of 49 million.
Renewable (D6) RIN generation in 2011 exceeded 13.5 billion, while compliance use was just over 10.1 billion towards the 12.6 billion gallon mandate. The gap between compliance use and the 2011 mandate was likely covered by the rollover of 2010 RINs into 2011. These numbers imply potential D6 rollover of just under 3.5 billion into 2012.
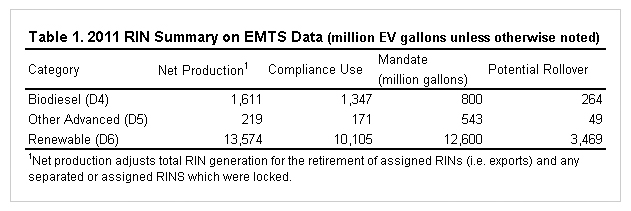
The potential rollover values in table 1 sum to a total potential RIN rollover of 3.78 billion. However, the 20% rollover rule implies a limit of 3.04 billion. Assuming obligated parties choose to roll the higher valued D-code RINs before lower values categories implies that 264 million D4, 49 million D5, and 2,727 million D6 RINs were rolled into 2012.
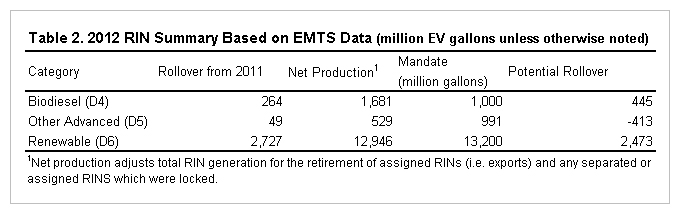
Table 2 provides a similar summary for 2012 RIN generation based on EMTS data, accounting for the potential rollover of 2011 RINs to meet the 2012 mandates. Compliance use for 2012 is not included as the compliance period has not yet ended. The 2012 mandate levels were used to calculate potential rollover of 2012 of RINs into 2013. Potential rollover is equal to the rollover from 2011, plus net production, less the mandate level (adjusted for EV value) by category.
Net D4 RIN generation and potential rollover from 2011 looks to be sufficient to meet the biodiesel mandate along with 445 million D4 RINs of additional rollover available for 2013. For the other advanced category, potential rollover from 2011 and net production in 2012 are not sufficient to meet the 991 million gallon mandate level leaving a gap of 413 million gallons. Note that the excess D4 RINs could be applied to fill this gap, or obligated parties could potentially borrow against their 2013 mandate. Despite net production of 2012 D6 RINs falling below the mandate level, potential rollover from 2011 is sufficient to meet the 2012 mandate and still allow for potential rollover of 2,473 million D6 RINs into 2013.
 <
<
Assuming the excess D4 RINs are used to cover the other advanced gap in 2012, the rollover potential across all D-codes sums up to just over 2.5 billion RINs with the vast majority in the D6 category. This falls below the limit of 3.31 billion implied by the 20% restriction on RIN rollover. This implies continued potential flexibility of the corn for ethanol demand in 2013 of approximately 900 million bushels.
Summary
The recent refusal of RFS waiver requests by the EPA was partially supported by estimates of a significant number of excess RINs which have been generated by ethanol producers and importers which could be used to meet biofuel mandates, reducing implied pressure on feedstock prices. EPA’s RIN stock estimates available for rollover largely exceeded those provided in recent farmdocDaily posts. The differences in estimates are due primarily to how the limits on RIN rollover across compliance periods outlined in the RFS are applied. As Scott Irwin and Darrell Good have illustrated in recent posts, a number of issues will be faced in continuing to meet the RFS mandates in the short term (most recently here). Thus, correctly understanding compliance rules in the RFS and navigating the RIN system will be extremely important for obligated parties.
Disclaimer: We request all readers, electronic media and others follow our citation guidelines when re-posting articles from farmdoc daily. Guidelines are available here. The farmdoc daily website falls under University of Illinois copyright and intellectual property rights. For a detailed statement, please see the University of Illinois Copyright Information and Policies here.