


Biofuel Exports with the RFS Mandates?
The continually increasing biofuel mandate volumes along with the challenges introduced by the E-10 blend wall are making it more difficult for obligated parties to comply with the RFS (see posts here, here, and here for more background). This has been reflected by the significant increase in RIN values since early in 2012. Yet, the U.S. continues to export both ethanol and biodiesel. Today’s post takes a look at U.S. biofuel exports and considers how they impact obligated parties’ ability to comply with the RFS mandates.
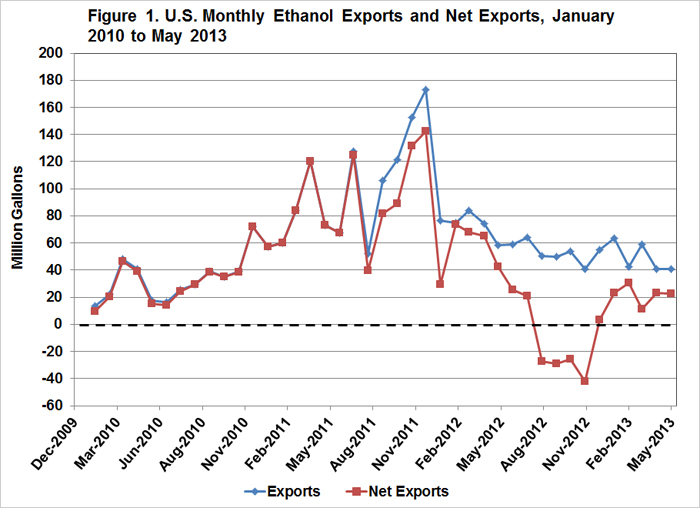
Using data from the Energy Information Administration, figures 1 and 2 plot recent monthly exports of ethanol and biodiesel, respectively. Monthly ethanol exports peaked in late 2011 and have since been on a general decline to between 40 and 60 million gallons per month. Monthly biodiesel exports increased through the first part of 2012 after seeing a steady decline throughout 2011. Exports then fell sharply at the end of 2012, but have again been on the rise, surpassing 23 million gallons in May of this year.

Seeing continued exports of biofuels is somewhat puzzling because exported biofuels cannot be used by obligated parties for compliance. Given the current situation with the E-10 blend wall, this is particularly surprising for biodiesel since it does not face the same blend wall issues as ethanol and D4 RINs can be applied towards the biodiesel, other advanced, or renewable mandate components.
While exports cannot be used towards mandate compliance, biofuel imports which originate from an approved pathway do come with RINs which can be applied towards the RFS. Figures 1 and 2 also report net exports (exports less imports) for ethanol and biodiesel in the U.S. With the exception of a four month period at the end of 2012, net exports of ethanol in the U.S. have been positive. Net exports of biodiesel have also generally been positive, with the exception of December 2011 and March 2013. Thus, more ethanol and biodiesel tend to be exported – reducing available gallons which could be applied towards mandate compliance – than enter the country as imported biofuel.
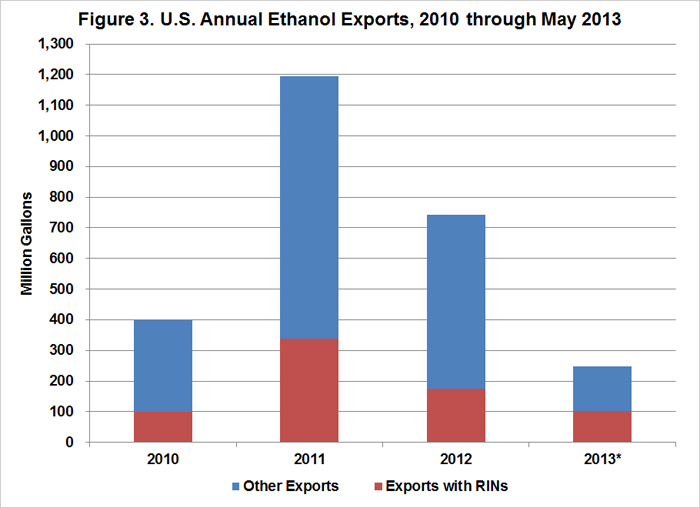
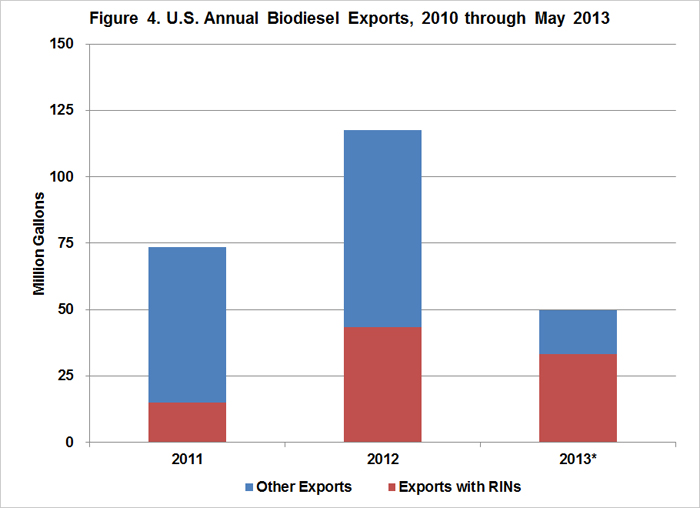
While these exports represent the potential loss of biofuel volumes, not all domestic biofuels are originated from producers who are approved to generate RINs. Figures 3 and 4 combine annual ethanol and biodiesel export levels with data from EPA’s Moderated Transaction System (EMTS) reflecting RIN separations due to exports, providing an estimate of the proportion of biofuel exports which were associated with RINs. From 2010 to 2012, an average of 25% of total ethanol exports included a RIN which had to separated and retired without being applied towards mandate compliance. Ethanol RINs separated due to export through June 2013 account for over 40% of total ethanol exports through May. For biodiesel, 20% of 2011 exports were associated with RIN separation. This increased to 37% of 2012 exports, and roughly 67% of exports thus far in 2013.
Summary
Despite the need for biofuels to meet domestic mandates outlined in the RFS, the U.S has continued to export both ethanol and biodiesel. Biodiesel exports have actually grown to record levels in 2013, even with the potential for use of D4 RINs towards the advanced and renewable mandate components due to E-10 blend wall limitations. Exports can of course be offset by biofuel imports, but even net exports continue to remain positive, in general, for both ethanol and biodiesel.
Exports do not necessarily represent a one-for-one loss of biofuel volumes which could be used towards RFS compliance since not all biofuels originate from RIN-generating producers. Data suggests that around 25% of ethanol exports have represented volumes which could have been used towards mandate compliance, but this proportion is slightly higher for 2013 exports. The proportion of biodiesel exports associated with D4 RINs has increased from 20% of exports in 2011 to 37% in 2012, and 67% of exports thus far in 2013. Thus, the data suggests that the majority of exported biofuels over the past three years have represented volumes which were not eligible for mandate compliance.
Still, RIN retirement data from the EPA indicates that D4, D5, and D6 RINs are separated and retired due to biofuel exports each year. This loss of RINs reduces the total supply for mandate compliance. While current RIN stocks look to be sufficient to aid in meeting mandate levels in the short-term, the drawdown of these stocks could impact the net biofuel trade position of the U.S. in the future.
Disclaimer: We request all readers, electronic media and others follow our citation guidelines when re-posting articles from farmdoc daily. Guidelines are available here. The farmdoc daily website falls under University of Illinois copyright and intellectual property rights. For a detailed statement, please see the University of Illinois Copyright Information and Policies here.