


Estimated ARC Program Performance in 2012
Despite the large yield losses experienced in Illinois, and many other areas of the corn belt, in 2012, support from the ACRE program is unlikely to trigger payments due to the record high marketing year average prices projected for corn and soybeans (see recent posts here and here). This differs from the case of the crop insurance program which provided significant payments throughout the corn belt in 2012 (see recent posts on 2012 crop insurance program losses here and here). Today’s post estimates payments which would have been triggered on corn and soybean acres for the county-level version of the Ag Risk Coverage (ARC) program being proposed in the Senate Farm Bill.
The ARC program’s revenue guarantee is based on the Olympic averages of county-level yields and national marketing year average prices over the previous 5 years. For 2012, it was assumed that yields from 2007 through 2011, and prices over the 2007 to 2011 marketing year periods, would be used to set the yield and price components of the revenue guarantee. Payments are triggered if actual revenues – the product of final county yield and the 2012 marketing year average price – fall below 88% of the revenue guarantee. ARC payments are capped at 10% of the revenue guarantee, and paid out on 80% of planted acres. County-level payment estimates were computed for all counties with full yield histories over the 2007 to 2012 crop years in Illinois, Indiana, Iowa, Minnesota, Missouri, Nebraska, and Ohio.
The 2012 marketing year average prices for corn and soybeans were taken from the September 2013 WASDE report from the USDA. Table 1 reports the actual and guarantee price levels for the ARC program in 2012, and compares them with the base and harvest crop insurance prices. The ARC price guarantee for corn acres in 2012 would have been $4.48/ bushel, compared with the $5.68 crop insurance base price. The ARC price guarantee for soybeans would have been $10.46/bushel compared with the crop insurance base price of $12.55.

For both corn and soybeans the actual ARC and harvest insurance prices were above their respective guarantees. The actual marketing year average price of $6.90 for corn was 54% above the ARC price guarantee. The crop insurance harvest price for corn was 32% above the base price. This price increase implies a required yield loss, relative the ARC guarantee, of 45% before an ARC payment would be triggered in a given county. The yield losses required to trigger a crop insurance payment for 85% RP or YP would be just 15%, or a required yield loss of 36% with RP-HPE at an 85% coverage level. The situation for soybeans was similar, with the actual ARC program price 38% higher than the guarantee and the harvest price for crop insurance being 23% above the base price. ARC payments for soybean acres would require a 38% yield loss in the county. Crop insurance payments for 85% RP or YP would require a 15% yield loss, while 85% RP-HPE coverage would require a 31% yield loss.
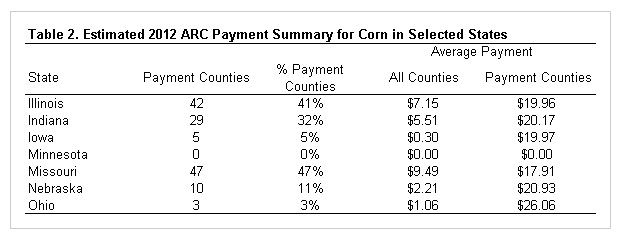
Tables 2 and 3 provide a summary of estimates of ARC program performance on corn and soybean acres in selected corn belt states had the program been offered in 2012. Average payment estimates were weighted by 2012 planted acreage by county, and are reported on a per planted acre basis. In some of the states hit hardest by the 2012 drought, payments would have been triggered on corn acres in a number of counties. In Illinois, 41% of the counties would have triggered county-level ARC payments. The average payment level averaged across all Illinois counties was estimated to be $7.15 per planted acre, while the average payment in counties where a payment was triggered was just under $20 per planted acre. Average payments in counties where payments were triggered in the other states reported in table 2 were similar. Exceptions include Minnesota, where the effects of the drought were not as significant on corn yields, and Ohio where only 3 counties would have triggered ARC payments on corn acres but the average payment would have been over $26 per planted acre in those counties.
Estimates of ARC program payments on soybean acres is provided in table 3. Missouri and Nebraska experienced some of the largest soybean yield losses from the 2012 drought, and ARC payments would have been triggered in a number of counties in both states. The average ARC payment on soybean acres in counties where a payment was triggered would have ranged from less than $20 per planted acre in Missouri to over $30 per planted acre in Indiana, Iowa, and Nebraska.

Summary
The 2012 drought led to significant corn and soybean yield losses throughout the corn belt. However, because prices for the 2012 marketing year are projected to reach record levels, the majority of counties in the states hit hardest by the 2012 drought – Missouri, Nebraska, and parts of Illinois and Indiana – would not have triggered county-level ARC payments. This differs considerably from crop insurance programs, particularly those which adjust the guarantee if the harvest price is higher than the base price. Furthermore, the average payment levels across all counties reported for corn and soybean acres in tables 2 and 3 are less than the average direct payment received on base acres in those states. Thus, while the drought in 2012 led to major yield losses, the effect of the increased prices would have likely resulted in county-level ARC program support levels below the current direct payment program for most corn and soybean producers.
Disclaimer: We request all readers, electronic media and others follow our citation guidelines when re-posting articles from farmdoc daily. Guidelines are available here. The farmdoc daily website falls under University of Illinois copyright and intellectual property rights. For a detailed statement, please see the University of Illinois Copyright Information and Policies here.