


Historical Variability of Soybean and Wheat Market Year Average Prices and Price Loss Coverage Payments
Based on historical variability, distributions of Market Year Average (MYA) prices for soybeans and wheat are developed and shown in this paper. From these distributions, the chance and payment rates of Price Loss Coverage (PLC) are calculated. Given a long-run price for soybeans of $11.00 per bushel, the chance of a PLC payment is 4% and the PLC rate is $.028 per bushel. Given a long-run price for wheat of $6.00 per bushel, the chance of a PLC payment is 31% and the payment rate is $.214 per bushel.
The distribution of MYA price is estimated based on a three step procedure. First, stable price periods are identified and price means are calculated for each period. During these stable periods, prices varied but did not trend up or down. Second, yearly price deviations from those period means are computed, yielding price deviations for each year. Third, a future price distribution is projected based on these historical price deviations using a projection for the future MYA price. A detailed application of this methodology is given for corn in a farmdoc daily article published on May 13, 2014.
Soybean Price
An $11.00 long-run price is used to estimate the soybean price distribution. This long-run price is lower than implied by current prices of Chicago Mercantile Exchange futures contracts. However there are reasons to believe these futures prices are high relative to long-run conditions (farmdoc daily February 27, 2013). The $11.00 price represents an expectation of the average MYA price over the next five to ten years. Some years the yearly MYA price will be higher than the long-run price and some years the yearly price will be lower. While prices will vary, averaging prices over the next five to ten years likely will come close to the long-run price close of $11 per bushel.
Figure 1 shows the distribution of soybean prices given an $11.00 price mean and historic price variability. As can be seen, the historical distribution suggests that a wide range of yearly MYA prices are possible. There is a 4% chance of a price less than $8.40 per bushel and a 7% chance of price above $14.00 per bushel.

Price Loss Coverage (PLC), a target price program contained in the 2014 Farm Bill, has an $8.40 reference price. When the MYA price is below $8.40, PLC will make payments. Projected PLC payments are estimated using the price distribution illustrated in Figure 1. When a price is below $8.40, a PLC payment rate is calculated as $8.40 minus the MYA price, with the result multiplied by .85. The .85 factor represents the fact that PLC payments will be paid on 85% of base acres. The PLC payment rate is averaged over all observations, including those that are zero.
With a long-run mean of $11.00, the price distribution in Figure 1 indicates a 4% chance of a PLC payment. The PLC payment rate will be $.028 per bushel. For a farm with a 45 bushel base yield, close to the average for Central Illinois, the average PLC payment will be $1.28 per acre.
Different long-run prices will have different PLC rates:
- A $9.00 long-run price will have a 37% chance of payment and a $.254 PLC rate per bushel.
- A $9.50 long-run price will have a 24% chance of payment and a $.157 PLC rate per bushel.
- A $10.00 long-run price will have a 16% chance of payment and a $.090 PLC rate per bushel.
- A $10.50 long-run price will have a 9% chance of payment and a $.050 PLC rate per bushel.
- An $11.00 long-run price will have a 4% chance of payment and a $.028 PLC rate per bushel.
- An $11.50 long-run price will have a 1% chance of payment and a $.020 PLC rate per bushel.
- A $12.00 long-run price will have a 1% chance of payment and a $.017 PLC rate per bushel.
Wheat Price
A $6.00 long-run price is used to estimate the wheat price distribution. Similar to soybeans, wheat’s long-run price is lower than implied by current prices of wheat futures contracts. However there are reasons to believe these futures prices are high relative to long-run conditions (farmdoc daily February 27, 2013). As can be seen in Figure 2, a wide possibility of yearly MYA prices exists. There is an 8% chance of a wheat price less than $4.50 per bushel. There is a 3% chance of a price above $7.25 per bushel.
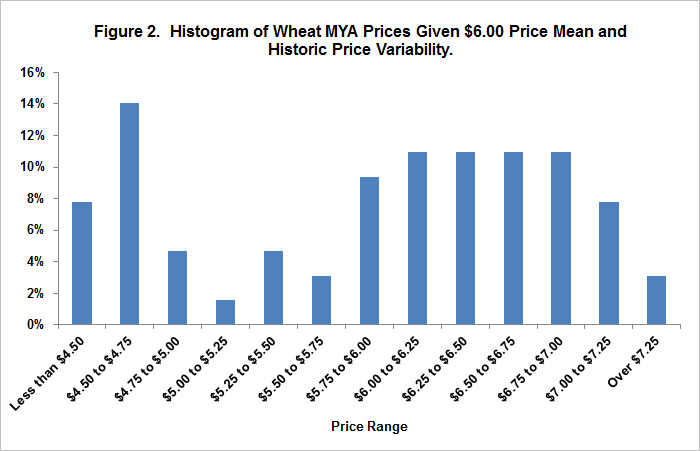
The PLC reference price for wheat is $5.50 per bushel. Given a $6.00 long-run mean, there is a 31% chance of a PLC payment. The PLC rate is $.214 per bushel. A farm with a base yield of 50 bushels per acre would have an expected payment of $10.70 per acre.
Different long-run prices will have different PLC rates:
- A $4.50 long-run price will have a 93% chance of payment and a $.870 PLC rate per bushel.
- A $5.00 long-run price will have a 69% chance of payment and a $.539 PLC rate per bushel.
- A 5.50 long-run price will have a 43% chance of payment and a $.334 PLC rate per bushel.
- A $6.00 long-run price will have a 31% chance of payment and a $.214 PLC rate per bushel.
- A $6.50 long-run price will have a 27% chance of payment and a $.125 PLC rate per bushel.
- A $7.00 long-run price will have a 19% chance of payment and a $.049 PLC rate per bushel.
- A $7.50 long-run price will have a 7% chance of payment and a $.013 PLC rate per bushel.
Summary
Historical variability suggests that there are a large range of possible MYA prices. Given a long-run price for soybeans of $11.00 per bushel, the chance of a PLC payment is 4% and the PLC rate is $.028 per bushel. Given a long-run mean for wheat of $6.00 per bushel, the chance of a PLC payment is 31% and the payment rate is $.214 per bushel.
The long-run price plays a key role in estimating chances and rates of PLC payments. Hence, price expectation could play a key role in commodity program choice. To fully evaluate the choice between the two commodity title alternatives — PLC and Average Crop Revenue (ARC) – estimates of ARC payments are needed. Publications in the future will evaluate these alternatives.
References
Irwin, S., and D. Good. "The New Era of Crop Prices --- A Five-Year Review." farmdoc daily (3):38, Department of Agricultural and Consumer Economics, University of Illinois at Urbana-Champaign, February 27, 2013.
Schnitkey, G., and D. Good. "Evaluating the Historical Variability of Corn's Market Year Average Price and Projecting Price Loss Coverage Payments." farmdoc daily (4):88, Department of Agricultural and Consumer Economics, University of Illinois at Urbana-Champaign, May 13, 2014.
Disclaimer: We request all readers, electronic media and others follow our citation guidelines when re-posting articles from farmdoc daily. Guidelines are available here. The farmdoc daily website falls under University of Illinois copyright and intellectual property rights. For a detailed statement, please see the University of Illinois Copyright Information and Policies here.