


Highlights of the 2012 Census of Agriculture: A Closer Look at Farm Size
As discussed previously, Illinois was home to 75,087 farms in 2012 (farmdoc daily, May 9, 2014), and the average farm size, as measured by acreage operated, increased by 3.2% from the 2007 Census of Agriculture (farmdoc daily, July 16, 2014). This article revisits the distribution of farm size, but highlights two important findings. One, the majority of Illinois’ small farms are dedicated to livestock production, and, two, the largest farms, in terms of acreage operated, account for a significant majority of the State’s value of agricultural production.
Distribution of Farm Size and Production Specialty
The Census of Agriculture defines a farm as any place from which $1,000 or more of agricultural products were produced and sold, or normally would have been sold, during the reference year.
In a previous article, we discussed how the distribution of farm size changed between the 2007 and 2012 Censuses using two measures of farm size, acreage operated and value of production (farmdoc daily, July 16, 2014). The Census suggests that the majority of Illinois farms are small according to either measure.
The chart below shows the distribution of Illinois farms by acres operated using 12 size categories. In addition, farms are categorized by their production specialization. The Census classifies each farm’s production specialization based on the North American Industry Classification System (NAICS). In figure 1, a “Livestock” farm is defined as any farm from which the majority of farm sales are from the production of beef cattle, feedlots, dairy, hog, poultry, sheep, or animal aquaculture. A “Vegetable, fruit, tree nut, or horticulture” farm includes farms that primarily produce vegetables, melons, fruit and tree nuts, green house, nursery, or floriculture. And the final category “Crop” includes oilseed, grain, tobacco, and other crops.
Of Illinois’ 75,087 farms, 77.3% could be classified as “crop” farms. However, more than 95% of the farms that span 1,000 or more acres are crop farms. In contrast, livestock farms account for 19.6% of all Illinois farms. While less than 5% of farms operating more than 1,000 acres are dedicated to livestock production, livestock farms account for 34.4% of Illinois farms with fewer than 50 acres. For Illinois’ smallest farms, those occupying fewer than 10 acres, 53.1% are livestock farms.

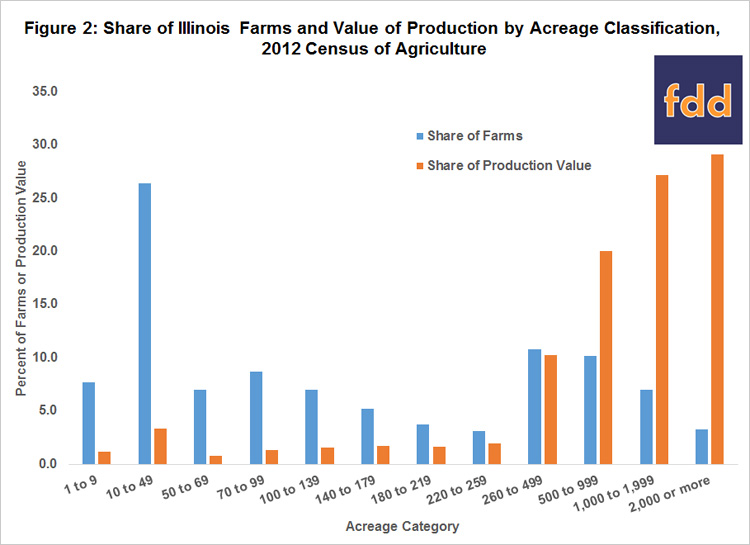
Distribution of Farm Size and Value of Production
Another interesting observation that can be made with respect to the distribution of farm size is that while the majority of Illinois farms are small, large farms account for the majority of the total value of agricultural production. Figure 2 shows the share of Illinois farms by acreage classification, as well as the share of the total value of agricultural production attributed to farms in each acreage classification. The chart demonstrates that a significant proportion (49.8%) of Illinois farms span fewer than 100 acres. However, all of the farms with fewer than 100 acres produced only 6.6% of the States’ $17.2 billion in agricultural products in 2012.
A popular rule of thumb in business, sometimes called the Pareto principle or 80-20 rule, states that roughly 80% of the effects come from 20% of the causes. For example, it is often suggested that in agriculture, 80% of commodities are produced by only 20% of farms. The 2012 Census of Agriculture provides some evidence in support of that notion. In 2012, 20.4% of Illinois farms operated more than 500 acres, and but they produced 76.2% of the total value of production.
References
Kuethe, T. "Highlights of the 2012 Census of Agriculture: Number of Farms." farmdoc daily (4):86, Department of Agricultural and Consumer Economics, University of Illinois, May 9, 2014.
Kuethe, T. "Highlights of the 2012 Census of Agriculture: Distribution of Farm Size." farmdoc daily (4):132, Department of Agricultural and Consumer Economics, University of Illinois, July 16, 2014.
Disclaimer: We request all readers, electronic media and others follow our citation guidelines when re-posting articles from farmdoc daily. Guidelines are available here. The farmdoc daily website falls under University of Illinois copyright and intellectual property rights. For a detailed statement, please see the University of Illinois Copyright Information and Policies here.