


Farm Safety Net Support for Cotton in Perspective
As discussed in several articles over the last year, support for cotton is a key contemporary farm policy issue (farmdoc daily, January 28, 2016; March 9, 2017; April 13, 2017; April 20, 2017; April 27 2017). These articles have discussed various aspects of the issue but have focused on assistance by the ARC (Agriculture Risk Coverage) and PLC (Price Loss Coverage) commodity programs. Cotton is not a covered commodity under these programs largely because of the World Trade Organization dispute with Brazil. Proposals exist to make cotton oilseed eligible for ARC/PLC payments. During the 2014 through 2016 crop years, cotton production has received support through the marketing loan and crop insurance programs equal to 12% of the value of cotton produced. In addition, the 2014 farm bill converted former cotton base acres into generic base, which are eligible for payment for covered commodities planted on the generic base (see the April 13, 2017 farmdoc daily article for a more in-depth discussion of generic base). These payments equal 7% of the value of cotton production. In comparison, the sum of marketing loan, crop insurance, ARC-CO (ARC-county), and PLC payments has averaged 13% for all covered commodities during the 2014-2016 crop years.
Marketing loan benefits are available to all production of a loan commodity on a farm enrolled in commodity programs (see data note 1 for a discussion of the marketing loan program). For the 2014-2016 crop years, the Congressional Budget Office reports marketing loan benefits of $742 million for upland cotton (see Figure 1 and data note 2). Next highest is wheat at $167 million. Marketing loan benefits are often thought of as income assistance in times of low prices. The upland cotton loan rate is set by the 2014 farm bill as a formula with lower and upper bounds. For the 2014-2016 crops, the average U.S. upland cotton loan rate was $0.52/pound of lint, the highest permitted rate. This loan rate is 68% of the 5-year average upland cotton price for the 2009-2013 crop years. Figure 2 also contains the same ratio for selected other crops. The range is 33% for temperate japonica rice to 68% for upland cotton and peanuts, with corn, soybeans, and wheat having ratios of 37%, 41%, and 45%. By this metric, loan rate support offered to upland cotton production is on the high end. In fact, the ratio of reference price to average 2009-2013 crop year price for soybeans (69%) and corn (70%) is on par with the cotton loan rate (68%).


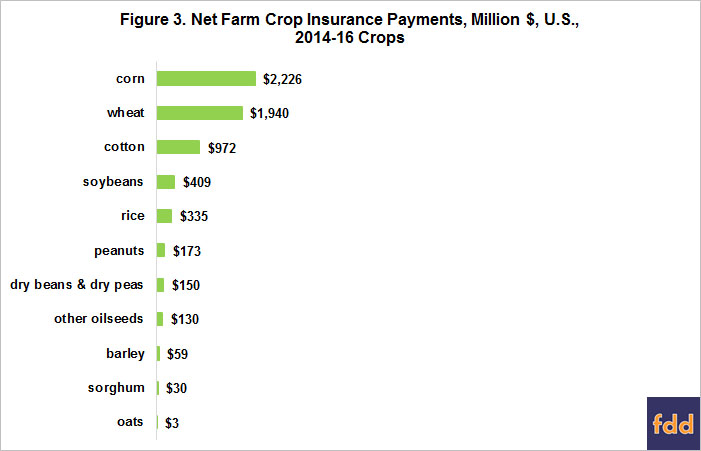
Net farm crop insurance indemnity payments equal indemnity payments received by farms minus the out-of-pocket insurance premiums paid by the farmers. According to data from the Risk Management Agency, net insurance payments are highest for corn at $2.2 billion, followed by wheat at $1.9 billion (see Figure 3 and data note 3). Cotton is third at $972 million, divided into $200 million for extra-long staple cotton and $772 million for upland cotton. The new STAX county insurance product created by the 2014 farm bill for cotton has made only $2 million in net farm insurance payments. Insurance indemnities are paid on production or land prevented from being planted. The sum of marketing loan and net insurance payments for cotton equals 12% of the value of the 2014-2016 cotton crops. The next highest share is 7% for wheat and the combined chickpea, dried pea and lentil category.
ARC-CO plus PLC payments to generic base for the 2014-2016 crop years are estimated at just over $1 billion (see Figure 4 and data note 4). To avoid double counting, payments made to a commodity planted on generic base are not counted in the payments reported for the covered commodity in Figure 3. Only payments to non-generic base acres of corn, wheat, rice, and soybeans exceed payments to generic base acres.

All farm safety net payments can be computed but the calculation mixes payments to production of a covered commodity with payments to base acres of a covered commodity. The latter are largely designed to provide support to farmers not to production of individual crops, although the generic base program has coupled program payments and production of a covered commodity. Since acres planted to a crop tend to change slowly over time, overlap exists between historical and current producers. Adding these two types of payments thus can provide a useful perspective as long as care is taken to understand the calculation. Because payments to generic base are tied to current crops planted on generic base, payments to generic base are reported separately.
Marketing loan and net insurance payments tied to the production of cotton and ARC-CO/PLC payments made on generic base both fall in the middle of the distribution of the sum of marketing loan, net insurance, and ARC-CO/PLC payments to covered commodities (see Figure 5 and data note 5). When the distribution of payments is measured relative to value of production, the 12% share of marketing loan plus net insurance payments to cotton production is notably smaller than the 29% and 27% share of marketing loan, net insurance, and ARC-CO/PLC payments to the value of peanut and rice production but approximately on par with the 13% average of payments by these 3 farm safety net programs to value of production for all covered commodities (see Figure 6 and data note 6). Payments to generic base equal 7% of the value of 2014-2016 cotton production. Comparison of Figures 5 and 6 illustrates the difference in perspective on farm safety net payments when viewed by level of payment and when viewed relative to value of a covered commodity’s production, and thus underscores the importance of considering both perspectives.

Summary Observations
- Production of cotton has received support from both the marketing loan program and crop insurance totaling 12% of the value of cotton produced during the 2014-2016 crop years.
- This level of assistance to cotton production is approximately on par with the average share of assistance provided by the marketing loan, insurance, and ARC-CO/PLC programs to all covered commodities.
- Owners of former cotton base acres, which include some current cotton producers, have received $1 billion plus in estimated 2014-2016 crop year payments via the generic base program.
- These observations make it difficult to conclude that either the production of cotton or owners of former cotton base have been left without support by the 2014 farm bill.
- However, the generic base program is likely creating frictions. Payments to covered commodities planted on generic base acres may be encouraging farmers to plant crops other than cotton, thus hurting both suppliers of cotton inputs and processors of cotton. In contrast, agribusiness suppliers and output processors serving other crops potentially benefits from more acres planted to these crops. In short, the generic base program is likely creating winners and losers within Southern agriculture. We will investigate these frictions in an article scheduled for publication next Thursday.
Data Notes
- The marketing loan program presents farmers with several options. A farmer may take out a nonrecourse loan at the loan rate, with a quantity of harvested crop serving as collateral. If market price is below the loan rate, the farmer can repay the loan at a lower rate, earning a marketing loan gain; or can forfeit the collateral to the government. To minimize forfeitures, Congress added the option of a payment in lieu of a loan, called a Loan Deficiency Payment.
- CBO reports data on a fiscal year (FY) basis. The latest data available for 2015-2017 FYs are used as they overlap the most with the 2014-2016 crop years. FY 2017 data are estimates.
- RMA does not report separate data for chickpeas (large and small), dried peas, and lentils. They are reported in 2 broader categories: dry beans and dry peas. The exact classification depends on a variety of factors including growing area.
- ARC-CO and PLC payments are based on actual payments reported by the Farm Service Agency for the 2014 and 2015 crop years plus payments for the 2016 crop estimated using the most recent data and a model housed at the University of Illinois, Urbana-Champaign.
- The total farm safety net payments for the chickpea, dried pea, and lentil category includes net insurance payments for the broader categories of dry beans and dry peas.
- No value of production is available for the small acreage crops of crambe and sesame.
References
Coppess, J., G. Schnitkey, C. Zulauf, and N. Paulson. "The Cottonseed Conundrum." farmdoc daily (7):77, Department of Agricultural and Consumer Economics, University of Illinois at Urbana-Champaign, April 27, 2017.
Coppess, J., C. Zulauf, G. Schnitkey, and N. Paulson. "Beneath the Label: A Look at Generic Base Acres." farmdoc daily (7):68, Department of Agricultural and Consumer Economics, University of Illinois at Urbana-Champaign. April 13, 2017.
Congressional Budget Office. "January 2017 Baseline for Farm Programs." January 24, 2017. Available at: https://www.cbo.gov/sites/default/files/recurringdata/51317-2017-01-usda.pdf
Congressional Budget Office. "March 2016 Baseline for Farm Programs." March 24, 2016. Available at: https://www.cbo.gov/sites/default/files/recurringdata/51317-2016-03-usda.pdf
Paulson, N., G. Schnitkey, J. Coppess, and C. Zulauf. "Have Generic Acres Impacted Planting Decisions?" farmdoc daily (7):73, Department of Agricultural and Consumer Economics, University of Illinois at Urbana-Champaign. April 20, 2017.
U.S. Department of Agriculture, Farm Service Agency. "ARC/PLC Program" and "ARC/PLC Program Data." May 2017. https://www.fsa.usda.gov/programs-and-services/arcplc-program/arcplc-program-data/index and https://www.fsa.usda.gov/programs-and-services/arcplc-program/index
U.S. Department of Agriculture, National Agricultural Statistics Service. May 2017. QuickStats. http://quickstats.nass.usda.gov/
U.S. Department of Agriculture, Risk Management Agency. Summary of Business Reports and Data. December 2016. http://www.rma.usda.gov/data/sob.html
Zulauf, C., G. Schnitkey, J. Coppess, and N. Paulson. "ARC-CO and PLC Payments for 2014 and 2015: Review, Comparison, and Assessment." farmdoc daily (7):44, Department of Agricultural and Consumer Economics, University of Illinois at Urbana-Champaign, March 9, 2017.
Zulauf, C., G. Schnitkey, J. Coppess, and N. Paulson. "Cottonseed and U.S. Oilseed Farm Program Issues." farmdoc daily (6):18, Department of Agricultural and Consumer Economics, University of Illinois at Urbana-Champaign. January 28, 2016.
Disclaimer: We request all readers, electronic media and others follow our citation guidelines when re-posting articles from farmdoc daily. Guidelines are available here. The farmdoc daily website falls under University of Illinois copyright and intellectual property rights. For a detailed statement, please see the University of Illinois Copyright Information and Policies here.