


Measuring Farm Policy, Part 2: Conservation & A Nutrient Loss Reduction Perspective
February 7th marked the 10th anniversary of the Agriculture Adjustment Act of 2014 (P.L. 113-79). Among other things, the 2014 Farm Bill initiated the ARC/PLC era of farm policy in which the choice between the two programs replaced the annual direct payments that had been a feature of farm policy since the 1996 Farm Bill. Roughly coinciding with the 2014 Farm Bill were key milestones in the Mississippi River/Gulf of Mexico Hypoxia Task Force efforts by the U.S. Environmental Protection Agency, including the framework memo in 2011 and the Harmful Algal Bloom and Hypoxia Research and Control Amendments Act of 2014 (EPA, History of the Hypoxia Task Force, updated August 29, 2023; P.L. 113-124).
Illinois initiated its Nutrient Loss Reduction Strategy (NLRS) in 2015 and released its latest biannual report in December 2023 (INLRS, 2023 Biennial Report; Illinois Department of Agriculture and Environmental Protection Agency, December 1, 2023). The latest report delivered unwelcome news: the levels of nitrogen and phosphorus exported from Illinois increased by 5% and 35% (respectively) as compared to the baseline (Jones, December 11, 2023; Haynes, January 5, 2024; Atkins, January 28, 2024). Also notable in the biannual report, the river flow or water yield was 23% higher than the baseline; when it rains, it pours, with consequences for nutrient losses (farmdoc daily, December 1, 2023; January 4, 2024; January 15, 2024). Farmers cannot control the weather or precipitation, but they can influence nutrient losses based on farm practices; similarly, farmers cannot control federal farm policy but can influence the priorities and outcomes in a farm bill. This article seeks to measure the conservation side of farm policy with perspectives from the efforts to reduce nutrient losses in Illinois.
Background
A significant portion of nutrients lost to waterways are attributed to agricultural production; therefore, items of agricultural production can provide at least some form of measure for public policy investments in conservation assistance to farmers. Part 1 of this series opened by measuring payments in relation to cash receipts (farmdoc daily, February 1, 2024). Given that conservation assistance is designed for more than mere income support, the discussion below will expand upon the items used for measurement. In addition, USDA’s Economic Research Service (ERS) recently released updated Wealth and Income data, which is used in this discussion (USDA-ERS, Farm Income and Wealth Statistics, February 7, 2024). The discussion also builds upon the work of the Policy Design Lab which will be periodically updated as new data is released and can be incorporated (https://policydesignlab.ncsa.illinois.edu/).
According to USDA data, Illinois has more than 27 million acres of farmland; on average from 2014 to 2022, farmers planted 22.7 million acres to field crops and 22.2 million acres to the program crops supported by Title I of the Farm Bill (NASS, Quickstats). Illinois thus accounts for just over 7% of the total acres planted to all field crops and over 8% of the total acres planted to program crops in those years. Table 1 summarizes Illinois production and acreage data.
| Table 1. Overview of Illinois Agriculture (Average 2014 to 2023) | |||
| Item | Amount | Share of National | Rank |
| Planted to field crops | 22.7 million | 7.21% | 4th |
| Planted to program crops | 22.2 million | 8.19% | 3rd |
| Acres insured, all crops | 19.5 million | 8.24% | 3rd |
| Acres insured, program crops | 19.4 million | 8.56% | 3rd |
| Acres planted to corn | 11.1 million | 12.37% | 2nd |
| Bushels of corn | 2.4 billion | 15.14% | 2nd |
| Acres planted to soybeans | 10.3 million | 12.16% | 1st |
| Bushels of soybeans | 672 million | 14.6% | 1st |
Based on its acreage footprint, it is reasonable to expect Illinois to rank high nationally in terms of cash receipts from farming and, to the extent that farm policies are to be relevant to farm realities, Illinois should also rank high in program benefits. Table 2 summarizes Illinois farm income statistics from the recent ERS release (note that state level data are only through 2022).
| Table 2. Overview of Illinois Income Statistics (Total, 2014-2022) | |||
| Item | Amount | Share of National | Rank |
| Cash receipts, all | $166.2b | 4.61% | 6th |
| Cash receipts, program commodities | $138.8b | 9.39% | 2nd |
| Government payments, all | $9.6b | 5.7% | 4th |
| Farm program payments | $2.1b | 5.72% | 7th |
| Ad hoc and supplemental payments | $5.7b | 5.9% | 4th |
| Agriculture Risk Coverage (ARC) | $1.8b | 10.05% | 3rd |
| Price Loss Coverage (PLC) | $280.3m | 1.63% | 17th |
| Conservation, all | $1.8b | 5.52% | 4th |
The Illinois data help anchor the analysis in the discussion, which will expand to all states. It will also extend beyond the ERS data to specific program level data reported by USDA’s Farm Service Agency (FSA) and Natural Resources Conservation Service (NRCS).
Discussion
To put it simply, achieving nutrient loss reduction requires some level of investment in conservation programs that assist farmers with the adoption of practices that are expected to reduce nutrient losses. Arguably, the most prominent—and likely one of the most effective—practices that a farmer can adopt is that of cover cropping, which establishes plants like cereal rye in the field after the commercial crop is harvested and are terminated for producing the next commercial crop. Measuring farm conservation policy could inform outcomes for addressing natural resource concerns such as nutrient losses from farm production.
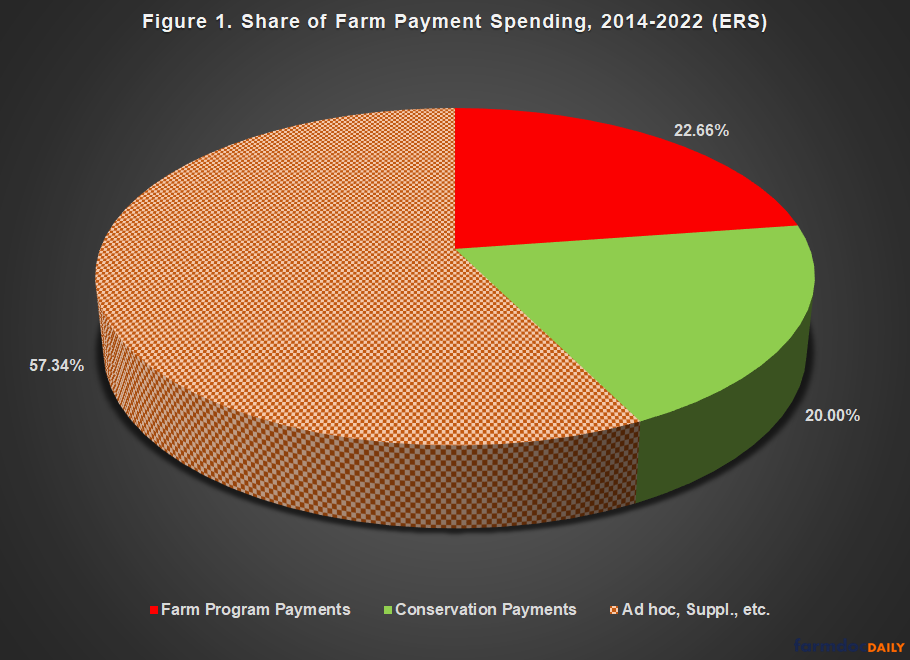
Figure 1 illustrates the spending priorities from 2014 to 2022 as reported by ERS with nearly 60% of the funds spent on payments to farmers coming from ad hoc, supplemental, or similar emergency assistance. Only about 20% of the spending on payments to farmers was considered for conservation. And while crop insurance premium subsidies are not paid directly to farmers, they are a further measure of spending and priorities. From 2014 to 2023, USDA’s Risk Management Agency reported $62.5 billion in premium subsidies. If added to the total, it would constitute 27% of the total and conservation’s share would drop to 14.6% of the total. If ad hoc, supplemental, etc. payments are removed conservation’s share of the total increases to 25%, followed by 28% for farm program payments, and 46.7% for crop insurance premium subsidy.
Three conservation programs account for the bulk of spending on farm conservation assistance: Conservation Reserve Program (CRP); Conservation Stewardship Program (CSP); and Environmental Quality Incentives Program (EQIP). Figure 2 illustrates the total spent on payments or financial assistance to farmers from these three programs each year. In total, from 2014 to 2023, nearly 51% of all payments came from CRP, 29% from EQIP, and 20% from CSP. Concerns about CSP were discussed previously. Only 31% of the CSP total has been since the changes in the program enacted by Congress in the 2018 Farm Bill and the program has shrunk substantially, both in terms of spending and potential to help farmers (farmdoc daily, October 12, 2023; November 10, 2023).
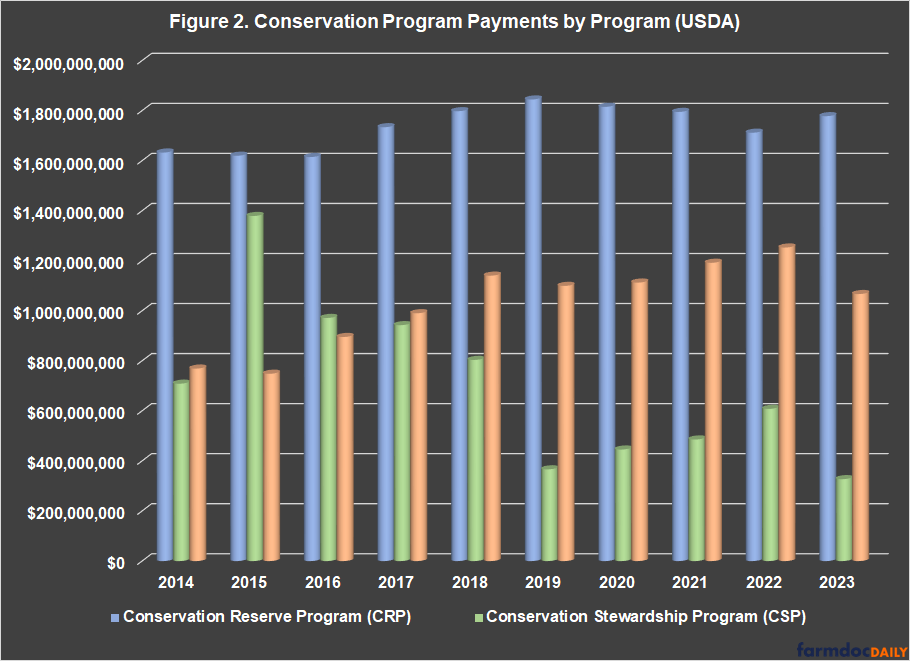
Figure 3 provides an initial measurement of farm conservation policy for these three programs by state. In the first column, each state’s share of the national total average acres planted to the program crops is used for ranking the states. The second column provides each State’s share of the national total for all three conservation programs reviewed (CRP, CSP, and EQIP), followed by a column for each State’s share of the national total for each program. Excluding Texas, note that the ten states with the highest shares of acres planted to the program crops generally receive larger shares from conservation programs that are acreage-based (CRP and CSP before it was revised in 2018). Texas (8.28%) and California (8.08%) lead all states in shares of the national total funding for EQIP, followed by Arkansas (4.24%).
As measured by state shares of the national totals for payments compared to acres planted, the recent historical experiences for farm conservation policy raise questions and concerns. Figure 4 provides a further measure of farm conservation policy by measuring the working lands conservation programs, EQIP and CSP against cash receipts for all commodities. The map in Figure 4 measures the difference between each state’s share of the total spent for both programs from the state’s share of total cash receipts for all commodities. States with positive numbers have a higher share of the EQIP and CSP payments than the State’s share of cash receipts, and vice versa.
By this measure, Illinois farmers may not be receiving a proportionate or fair share of the total assistance from EQIP and CSP (-2.1), because the combined 2.5% share of EQIP and CSP is much less than the 4.6% share of the national total cash receipts. Of the two programs, EQIP stands out: 1.32% of the national total for a state ranked 3rd in terms of the total acres planted to program crops (8.2%); Illinois ranks 34th in total EQIP spending from 2014 to 2023. As measured by the soil health practices that USDA qualified for 2023 IRA funding, Illinois ranks 26th in the Nation with slightly less than 1.6% of the national total. Nationally, those practices accounted for 12.7% of total EQIP spending. As measured by assistance for adopting cover crops, Illinois again ranks 26th in the nation with 1.2% of the total funds spent on cover crops from 2014 to 2023 (just over $900 million, or about 9% of total EQIP). Ilinois does better under CSP, ranking 11th and bringing in about 4.2% of the national total. Of course, CSP assistance has shrunk substantially since the 2018 Farm Bill. The IRA funding for CSP in FY2023 did little to improve the situation for Illinois. Illinois farmers received only 2.8% of the total funds obligated and 2.4% of funded applications but made up 5.6% of the applications in the conservation bardo (approved but not funded) (see, farmdoc daily, September 28, 2023; Happ, January 29, 2024).
Concluding Thoughts
Measuring public policy provides insights on priorities for public funds, as well as feedback on program operation for the policymaking processes. No matter how it is measured, assistance to farmers for conservation purposes has been the lowest priority for federal farm policy. For example, conservation programs are designed with caps—limits on the total funds available EQIP and CSP) or limits on the number of acres that can be enrolled (CRP)—that have no equal in farm payment programs. Moreover, conservation assistance must be allocated among dozens of different practices and is available to all farming operations. How those limited funds or acres are allocated may prompt political questions but, more importantly, the allocations have significant consequences on the ground. For farmers, limits on conservation lead to application backlogs and the conservation bardo, while also complicating the investments in farms and the natural resources vital to farming. For the public funding the policies, these outcomes drastically limit the benefits society receives. The nutrient loss reduction challenge is a primary example. Nutrient losses are a challenge for working lands, largely the result of fertilizers applied to row crops, but, as measured in this article, these limited public investments are further diminished by disparities in allocations. Unfortunately, Illinois has been an exemplar.
References
Atkins, Karina. “Illinois farmers struggle to balance livelihoods with reducing agricultural runoff, a major contributor to Gulf dead zone.” Chicago Tribune, January 28, 2024. https://www.chicagotribune.com/2024/01/28/illinois-farmers-struggle-to-balance-livelihoods-with-reducing-agricultural-runoff-a-major-contributor-to-gulf-dead-zone/.
Coppess, J. "Farm Bill 2023: NRCS Backlogs and the Conservation Bardo." farmdoc daily (13):177, Department of Agricultural and Consumer Economics, University of Illinois at Urbana-Champaign, September 28, 2023.
Coppess, J. "Measuring Farm Policy, Part 1: Cash Receipts and Program Payments." farmdoc daily (14):22, Department of Agricultural and Consumer Economics, University of Illinois at Urbana-Champaign, February 1, 2024.
Coppess, J. "The Conservation Question, Part 9: The Arrested Development of the Conservation Security Program." farmdoc daily (13):206, Department of Agricultural and Consumer Economics, University of Illinois at Urbana-Champaign, November 10, 2023.
Coppess, J. "The Incredible Shrinking of the Conservation Stewardship Program." farmdoc daily (13):187, Department of Agricultural and Consumer Economics, University of Illinois at Urbana-Champaign, October 12, 2023.
Happ, Michael. “Opening the door for more conservation.” IATP.org. January 29, 2024. https://www.iatp.org/opening-door-more-conservation.
Haynes, Betty. “Illinois fertilizer loss: 1 step forward, 2 steps back.” Farmprogress.com. January 5, 2024. https://www.farmprogress.com/conservation-and-sustainability/illinois-fertilizer-loss-1-step-forward-2-steps-back-.
Illinois Nutrient Loss Reduction Strategy Biennial Report 2021-22. (2023). Illinois Environmental Protection Agency and Illinois Department of Agriculture; Springfield, Illinois. University of Illinois Extension; Urbana-Champaign, Illinois.
Jones, Lyndsay. “A report on nutrient pollution in Illinois’ waterways shows more work is needed.” NPRIllinois.com. December 11, 2023. https://www.nprillinois.org/illinois/2023-12-11/a-report-on-nutrient-pollution-in-illinois-waterways-shows-more-work-is-needed.
Skidmore, M. and J. Coppess. "When It Rains, It Pours: Extreme Precipitation & Nutrient Loss, Part 1." farmdoc daily (13):222, Department of Agricultural and Consumer Economics, University of Illinois at Urbana-Champaign, December 7, 2023.
Skidmore, M. and J. Coppess. "When It Rains, It Pours: Extreme Precipitation & Nutrient Loss, Part 2." farmdoc daily (14):3, Department of Agricultural and Consumer Economics, University of Illinois at Urbana-Champaign, January 4, 2024.
Skidmore, M. and J. Coppess. "When It Rains, It Pours: Extreme Precipitation & Nutrient Loss, Part 3." farmdoc daily (14):10, Department of Agricultural and Consumer Economics, University of Illinois at Urbana-Champaign, January 15, 2024.
Disclaimer: We request all readers, electronic media and others follow our citation guidelines when re-posting articles from farmdoc daily. Guidelines are available here. The farmdoc daily website falls under University of Illinois copyright and intellectual property rights. For a detailed statement, please see the University of Illinois Copyright Information and Policies here.