


Mapping Soybean Yield Risk: Regional Contrasts in the U.S. and Brazil
Brazil’s soybean yields have grown faster than those in the United States, though this growth is not uniform across Brazil’s major producing regions (see farmdoc daily, February 20, 2025). While trend yields reflect the average rate of yield improvement over time, they do not capture the year-to-year variability that translates into production risk. This variability—measured as percent deviations from trend—offers key insights into the stability and reliability of yield growth. Building on previous analysis of Brazil’s trend yield potential and deviations (see farmdoc daily, January 12, 2017), this article examines how yield variability differs across Brazil’s main soybean-growing regions and compares these patterns to the main production regions in the U.S. Understanding relative production risk is essential for evaluating future agricultural expansion, its role in global supply chains, and the United States’s competitiveness with Brazil.
National Soybean Yields Deviates from Trend in the U.S. and Brazil
National soybean yield data from the National Agriculture Statistics Service (NASS) of the USDA and the Brazilian Institute of Geography and Statistics (IBGE) are used to assess yield variability — or yield risk — at the national levels. We first detrend each national yield series with a linear trend from 1974 to 2023 (see Figure 1). Deviations from the trend, or residuals, are then expressed as percentages of the trend yield, enabling standardized comparisons across regions with different yield levels. We then summarize yield variability using the standard deviation of these percentage deviations, providing a single metric that captures historical yield variability. This variability can be interpreted as production risk, reflecting the combined effects of weather and general growing conditions, farmers’ management decisions, and other factors that might influence yield outcomes. A higher standard deviation indicates greater yield variability and, thus, higher production risk.
Figure 1: Variability in Soybean Trend Yields, U.S. and Brazil at national levels, 1974-2023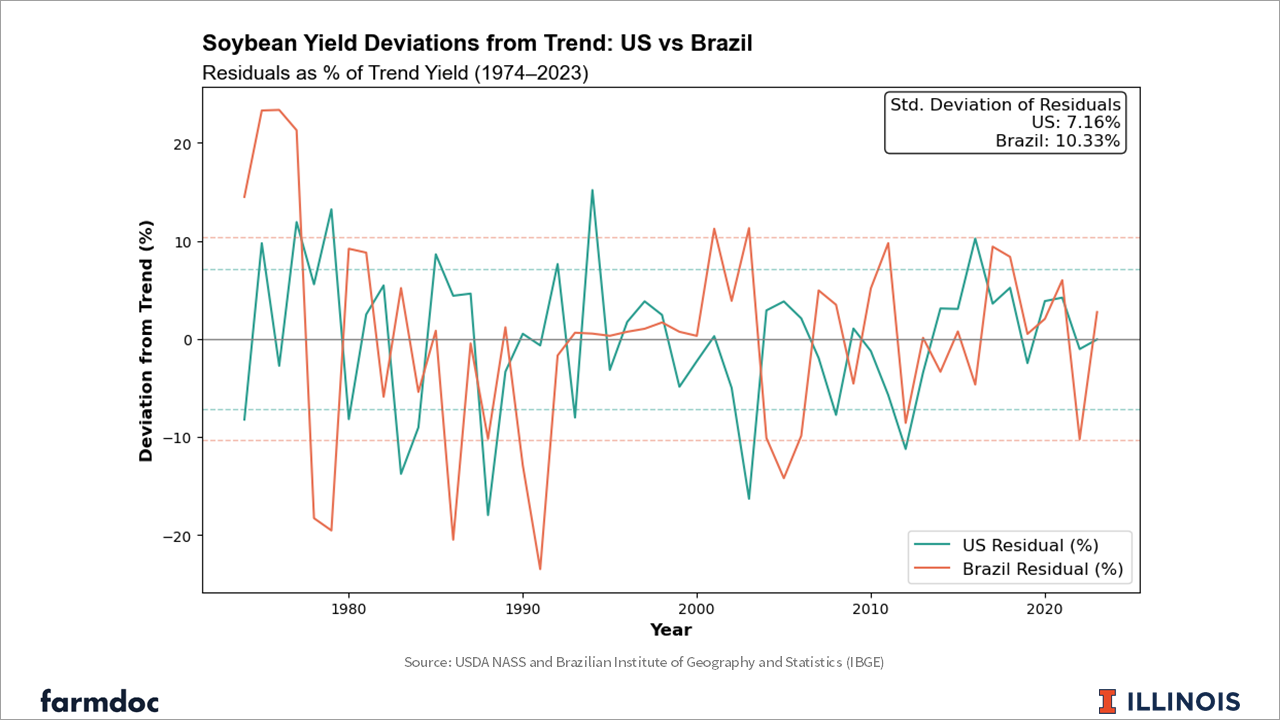
At the national level, Brazil has a 10.3% standard deviation of the variability from trend. This means that in roughly two-thirds of years, actual yields fell within 10.3% of expected trend yields. For instance, if the expected yield for 2025 is 50 bushels per acre, based on historical variability, 2025 yields will likely fall between 44.85 and 55.15 bushels per acre. When comparing Brazil and the U.S. at national levels, the U.S. has lower yield variability with a 7.2% standard deviation compared to Brazil’s 10.3%. This indicates a narrower range of yield outcomes relative to trend and a lower level of production risk than Brazil. However, both are large countries with distinct production regions that face different levels of yield risk.
Regional Yield Variability Within the United States
To analyze yield variability within the U.S., we use non-irrigated county-level soybean yields from the Risk Management Agency (RMA) from 1991-2023. While not shown, we also examined yield variability using county-level yields from NASS. Differences in regional yield variability between the RMA and NASS yield data tend to occur in areas where irrigation is more widely used as the NASS county yields are not reported separately by practice. Thus, to better compare to Brazil’s regions, which are mostly rainfed, we focus on the RMA data for the comparison.
Soybean yield variability across regions of the U.S. tends to be higher than for the national average yield. In some cases the variability at the regional level is considerably higher. (see Figure 2). The low national yield variability for the U.S. is a function of the concentrated geographic production in areas with lower yield risk — such as the Midwest — and diversification effects across regions.
Figure 2: Variability in Soybean Trend Yields Across U.S. Regions. Standard deviation of yield deviations from trend, expressed as a percentage of trend yield (1991–2023)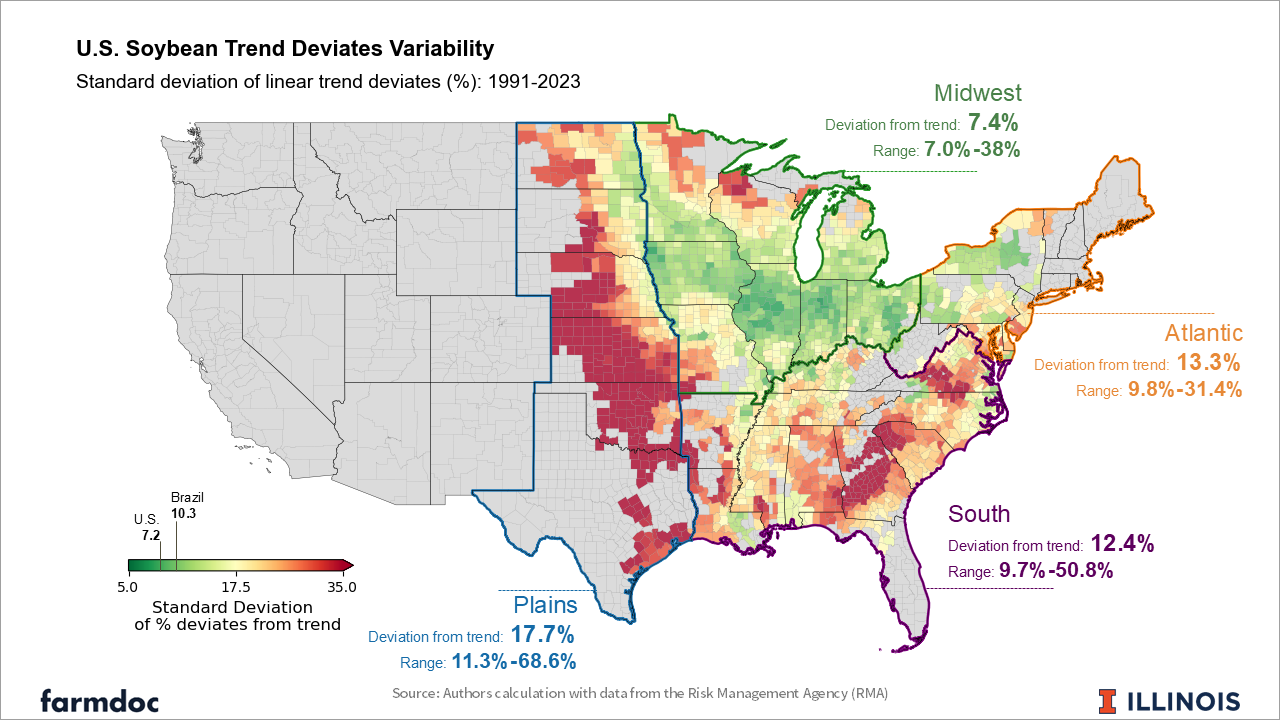
The Midwest stands out as the most stable region, with a standard deviation of 7.4%. This stability can be attributed to its fertile soils and favorable growing conditions which support soybean production. In contrast, the Plains region is much more variable, with a standard deviation of 17.7%. This can be partially explained by the fact that irrigated soybeans – common in parts of Kansas and Nebraska – are not included in the analysis. There is also some difference between the Northern plains (Dakotas) and the mid-south, with less variable yields in the northern and eastern portions of the region. This is reflected in a high range of variability within the Plains region.
The South also shows considerable variability (12.4%), particularly in areas farther from the Mississippi River. There is also a wide range of variability within the region, which suggests that aggregate risk may be partially reduced through offsetting effects between counties. Lastly, the Atlantic exhibits moderate variability (13.3%). However, it contributes relatively little to national yield volatility due to its smaller share of total U.S. soybean production.
Yield Variability Within Brazil
Brazil’s soybean production is highly concentrated in a single region—the Center-West. The Center-West region accounted for nearly 50% of Brazil’s soybean production in the 2023/2024 crop season (Conab, 2025). Although some subregional variability exists, the overall aggregate standard deviation of the trend deviates for the Center-West is 7.1%. This is lower than any of the Center-West’s individual subregions, suggesting some diversification effects even within the Center-West area. This implies that when one subregion experiences lower-than-expected yields, others may partially offset the shortfall with better-than-expected yields. It is also worth noting that Brazilian microregions are often larger than U.S. counties, encompassing more farms and, thus, naturally smoothing variability.
Figure 3: Variability in Soybean Trend Yields Across Brazil Regions. Standard deviation of yield deviations from trend, expressed as a percentage of trend yield (1974–2023)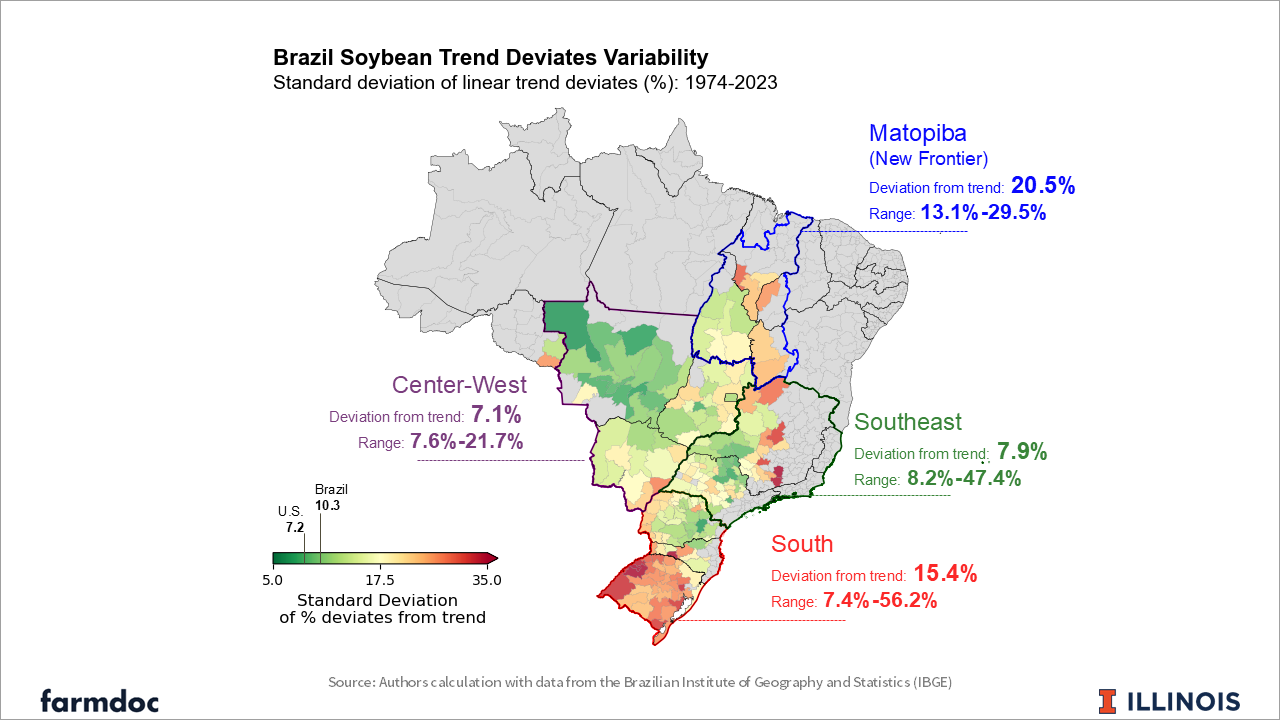
The Center-West region is more stable due to a favorable climate, well-established cropland, and use of modern agriculture practices. Large-scale farm operations also contribute by facilitating technology adoption that increase operational efficiency, and offsetting risk within the farm, and subregions.
In contrast, the South region exhibits greater variability, with a standard deviation of trend deviates of 15.4%. In fact, it could be divided into two parts: the Southern, which is more susceptible to climate, and, thus, highly risky; and Northern, which has more stable yields. The southernmost states, such as Rio Grande do Sul, face higher production risk, which is corroborated by farmer sentiment. In a recent survey, producers in the region cited climate variability as their main source of risk (see farmdoc daily, January 13, 2025). Moreover, farm operations in the South are typically smaller and more fragmented than those in the Center-West, limiting scale efficiencies and increasing vulnerability to shocks.
The Matopiba region—Brazil’s most recent agricultural frontier—shows the highest level of yield variability among all analyzed regions, with a standard deviation of trend deviates of 20.5%. This can be partially attributed to more recent conversion of degraded pastureland into crop production that has not reached agronomic maturity.
Lastly, the Southeast region presents a mixed profile, with a standard deviation of trend deviates of 7.9%. While some subregions exhibit moderate variability, areas adjacent to the Center-West (in the Brazilian Cerrado) present more stable yield patterns. These interior areas share climatic and operational characteristics with the Center-West, contributing to their relative resilience.
Comparing Regions between U.S. and Brazil
Figure 4 provides a comparison of productivity (average yield level) and risk (yield variability from trend). Quadrants are defined in Figure 4 using the US as the benchmark. Points above (below) the US have greater (lesser) yield risk, while points to the left (right) of the US have lower (higher) yield levels.
When comparing Brazil and U.S. regions, the Midwest can be compared to the Brazilian Center-West in terms of production/yield risk, although the Midwest has presented slightly higher yields in the last five years, as shown in Figure 4.
Figure 4: Soybean Trend Yields Deviates Variability and Yield Levels, Brazilian Regions, Brazil, U.S. Regions and U.S.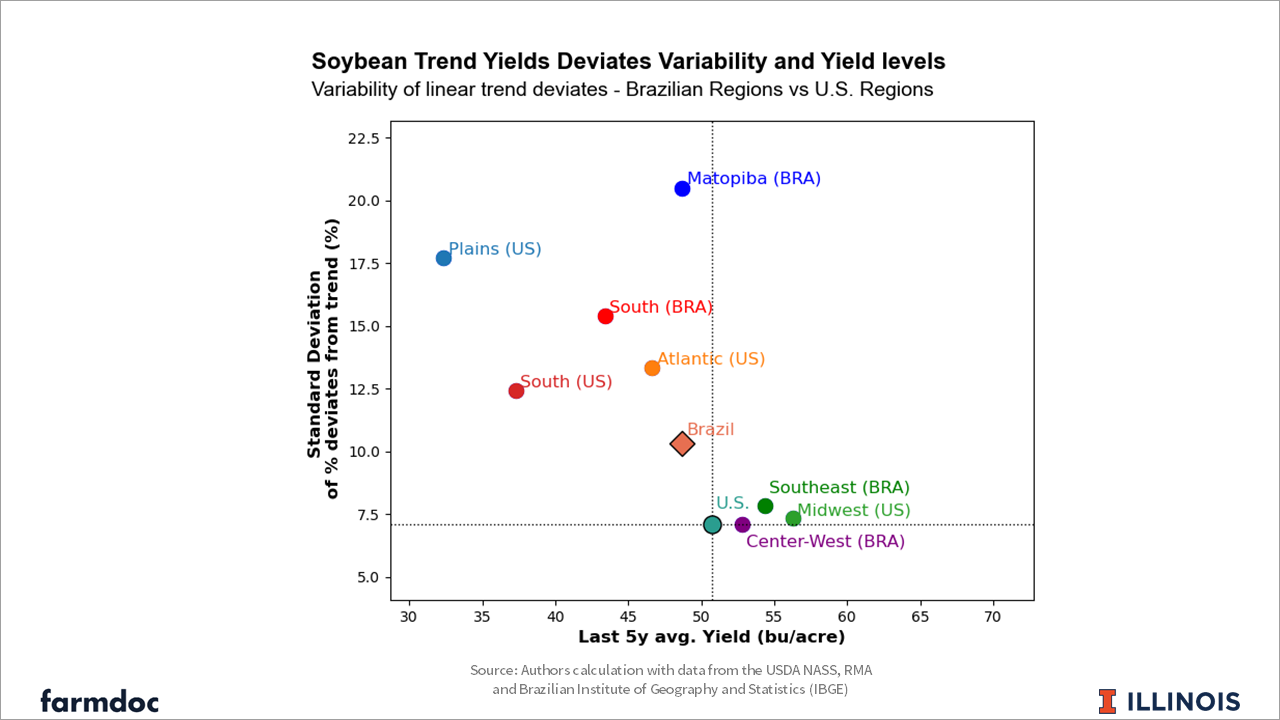
The U.S. Plains, Atlantic and South regions are riskier than Brazil’s national yields, but comparable to the Brazilian South region and Matopiba. Despite being the most variable region, Matopiba had a higher average yield in the last five years than the Plains, Atlantic and the South of U.S. Finally, although the Brazilian Southeast has relatively low variability and high yield levels, its share of Brazil’s national production is low, given competition with other crops (see farmdoc daily, February 20, 2025).
Discussion and Implications
Yield variability or yield risk, like yield levels, varies across regions within both Brazil and the U.S. This variability directly translates into production risk. Regions where yields deviate more from the trend face greater uncertainty, impacting producer income, financial planning, and long-term investment decisions.
Lenders and investors might prefer regions with more stable yields with the perception of less volatile operational cash flows. This translates into more favorable credit terms and increased investment flows. This is the case of the U.S Midwest and Brazilian Center-West, which are more stable regions in terms of yields.
However, it is important to interpret low-yield variability with caution. According to risk balancing theory, as business risk—including production risk—declines, farmers may offset this by increasing their financial risk, for example, through greater leverage (Featherstone et al., 1988). As a result, seemingly stable regions may still carry significant total risk if producers respond by borrowing more, for instance. Therefore, low production variability does not necessarily imply low overall risk. Moreover, other sources of risk such as political, legal, logistic, etc, that might play a role in regional total risk assessments.
When comparing the U.S. and Brazil, one must also consider production risk mitigation tools. In the U.S., crop insurance is widely adopted and plays a major role in stabilizing farm incomes in the face of yield shocks (Newton, 2020). In Brazil, while crop insurance is less widespread, producers often adopt alternative strategies such as double cropping, which spreads risk across seasons (see farmdoc daily, April 9, 2024; Monaco et al., 2024).
Regarding production risk, the Center-West has relatively more stable yields, while Matopiba shows far more variation. As a result, expanding production in Matopiba will require higher expected returns or effective risk mitigation strategies to justify investment in the face of greater uncertainty. Moreover, expanding into such high-risk areas demands greater liquidity from farmers to buffer negative cashflows caused by production shocks (Monaco et al. 2024)
In addition to variability within countries, aggregate supply shocks across major producing regions are important for global markets. When Brazil and the U.S. experience negative yield deviations in the same year—especially in their major production regions—the combined impact on global soybean supply can be substantial. Therefore, from a market and policy perspective, it is not just the individual variability within each country that matters, but the possibility of concurrent yield shortfalls that create global supply disruptions and price volatility.
Finally, it is important to acknowledge that estimates of trend yields, and variability are sensitive to the functional form and period analyzed (see farmdoc daily January 12, 2017; and April 16, 2024), and one should be careful in extrapolating results.
Conclusion
Brazil’s soybean production presents strong growth in yields, but with significant regional variation in both productivity and yield risk. While the Center-West stands out for its yield stability and growing importance in national output, regions such as Matopiba offer high yield potential but face much greater production risk. Compared to the U.S., Brazil exhibits greater yield volatility at the national level. However regional comparisons reveal some overlap in risk profiles—particularly between high-risk regions like Matopiba and the U.S. South or Plains and more stable areas such as Brazil’s Center-West and the U.S. Midwest.
Understanding and managing yield variability will be essential as Brazil looks to expand its soybean acreage, especially through pastureland conversion, understanding and managing yield variability will be essential. Ultimately, Brazil’s long-term competitiveness in global soybean markets will depend not only on continued productivity gains, but also on targeted investments in infrastructure, crop management, and financial tools that support risk mitigation amid expansion.
References
Cabrini, S., J. Colussi, G. Schnitkey, and S. Irwin. “Beyond the Climate: Multiple Sources of Risk in the United States, Brazil and Argentina.” farmdoc daily (15): 8, Department of Agricultural and Consumer Economics, University of Illinois at Urbana-Champaign, January 13, 2025.
Colussi, J., N. Paulson, G. Schnitkey, C. Zulauf and J. Baltz. "Potential for Crop Expansion in Brazil Based on Pastureland and Double-Cropping." farmdoc daily (14):69, Department of Agricultural and Consumer Economics, University of Illinois at Urbana-Champaign, April 9, 2024.
Companhia Nacional de Abastecimento (CONAB). (2025, February). Monitoring of the Brazilian Grain Harvest, Volume 12, 2024/25 Harvest, No. 5, Fifth Survey. Brasília, DF: CONAB. Retrieved from https://www.conab.gov.br/info-agro/safras/graos
Hubbs, T., S. Irwin and D. Good. "Assessing Argentina Soybean Yield Risks: Historical Deviations from Trend." farmdoc daily (7):14, Department of Agricultural and Consumer Economics, University of Illinois at Urbana-Champaign, January 26, 2017.
Hubbs, T., S. Irwin and D. Good. "Assessing Brazilian Soybean Yield Risks: Historical Deviations from Trend." farmdoc daily (7):5, Department of Agricultural and Consumer Economics, University of Illinois at Urbana-Champaign, January 12, 2017.
Featherstone, A. M., Moss, C. B., Baker, T. G., & Preckel, P. V. (1988). The Theoretical Effects of Farm Policies on Optimal Leverage and the Probability of Equity Losses. American Journal of Agricultural Economics, 70(3), 572–579. https://doi.org/10.2307/1241495
Monaco, H., C. Ortiz, L. Caetano, C. Müller, and J. Jägermeyr, 2024: The economics of farming expansion in the Brazilian Cerrado under possible effects of climate change. Int. Food Agribus. Manag. Rev., 27, no. 3, 441-462, doi:10.22434/ifamr1028.
Monaco, H., J. Colussi, and G. Schnitkey. “Brazil’s Agricultural Expansion: Where Are Soybean Yields Headed?” farmdoc daily (15): 33, Department of Agricultural and Consumer Economics, University of Illinois at Urbana-Champaign, February 20, 2025.
Newton, J. (2020, October 27). Majority of crop acres covered by crop insurance. American Farm Bureau Federation. https://www.fb.org/market-intel/majority-of-crop-acres-covered-by-crop-insurance
Paulson, N., G. Schnitkey and C. Zulauf. "Variability in Trend Estimates for US Corn Yields." farmdoc daily (14):72, Department of Agricultural and Consumer Economics, University of Illinois at Urbana-Champaign, April 16, 2024.
Disclaimer: We request all readers, electronic media and others follow our citation guidelines when re-posting articles from farmdoc daily. Guidelines are available here. The farmdoc daily website falls under University of Illinois copyright and intellectual property rights. For a detailed statement, please see the University of Illinois Copyright Information and Policies here.