


Variability in Trend Estimates for US Corn Yields
Trend yield estimates for crop yields are used in making projections for future yields as well as to assess realized historical yield performance against an appropriate “trendline” expectation. Yield trends can be sensitive to the data that are used to estimate them.
Today’s article continues our analysis of US corn yields illustrates the impact of the length of the historical period used on the variability in trend estimates, using US corn yield since 1950 from the USDA as an example (see farmdoc daily article from March 26, 2024 for the previous article in this series). Trends estimated over long periods are much less variable than estimates based on short time periods.
Very short periods, such as 10-year trend estimates, can be highly sensitive to individual yields, resulting in potentially misleading results. In contrast, longer time periods will generate less variable trend estimates but will also adjust much slower to structural changes to future yield growth. The choice of an appropriate period over which to estimate yield trends is difficult and must balance this tradeoff in the variability of trend estimates.
Trend Yield
Yield trend refers to how average or expected crop yields evolve through time. Yield trend estimates are commonly interpreted as the impact of changes in technology and management practices on yield holding other factors, such as weather and growing conditions, constant. In effect, trend estimates provide expectations for crop yields under “normal” growing conditions.
Estimates of yield trends have a variety of uses and applications. Yield trends are used when constructing forecasts of yields in future periods which can impact budgeting and planning decisions at the farm level, projections for farm policy spending, and price reactions in global commodity markets. Trend estimates are also used to assess and compare current and historical yield outcomes to trendline expectations, with historic variation from trend often used to project potential yield variability in the future.
Trend yield is commonly estimated using relatively simple statistical regression methods which fit a “trendline” to historical yield data. The trendline is fit so as to minimize the squared deviations of actual yields from the trendline over the period analyzed. Thus, trend estimates are directly impacted by the data to which they are fit. Today’s article focuses on simple linear trendlines fit to US corn yield data and how the amount of data, or number of years, used can impact trend estimates. Note that yield projection models can also account for potentially non-linear trends (see farmdoc daily article from December 6, 2023) and directly control for other factors impacting yields such as weather (see farmdoc daily article from April 8, 2024).
Data
We used average US corn yield data provided by the USDA’s National Agricultural Statistics Service (USDA-NASS) from 1950 to 2023. Figure 1 shows the full series of US corn yields since 1950, along with a simple linear trendline fit to all 74 years of the data. Fitting the trendline to the full data series from 1950 to 2023 results in a trend estimate of 1.926, implying that the average increase in corn yields since 1950 has been 1.926 bushels per acre per year.
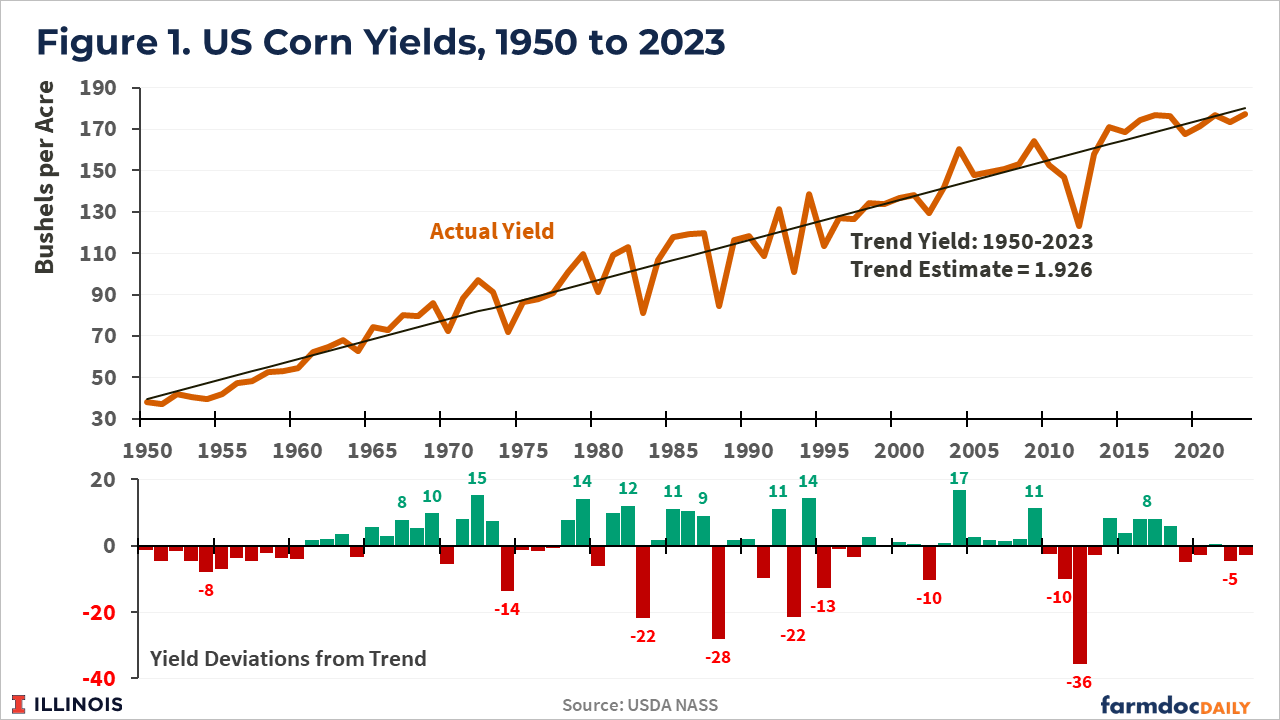
The lower portion of Figure 1 reports yield deviations from the trendline, indicating whether actual yield was above or below trend expectations for each year. Both positive and negative yield deviations occur. Negative yield deviations occurred 35 of the 74 years, averaging 7.2 bushels per acre below trend. Positive yield deviations occurred 39 times, averaging 6.4 bushels per acre above trend.
Trend Yield Estimates Over Different Timeframes
Simple linear trendlines were fit to the US average corn yield data for different period lengths ranging from as long as 60 years to as short as 10 years. Trend estimates were computed for every possible period length in the US corn yield data since 1950. For example, 60-year trends were estimated for 1964-2023, 1963 to 2022, 1962 to 2021, and so on back to the 1950 to 2009 period. This results in multiple trend yield estimates for each period length.
Table 1 reports a summary of the trend estimates for each of the period lengths considered. For the 60-year trend, the 15 estimates ranged from 1.84 to 1.98 bushels per acre per year, with a median of 1.87. Half of the estimates fall between 1.86 and 1.88 bu/acre/year (the 25th and 75th percentiles). The 50-year trend provides 25 estimates ranging from 1.76 to 1.95 bu/acre/year with a median of 1.88.
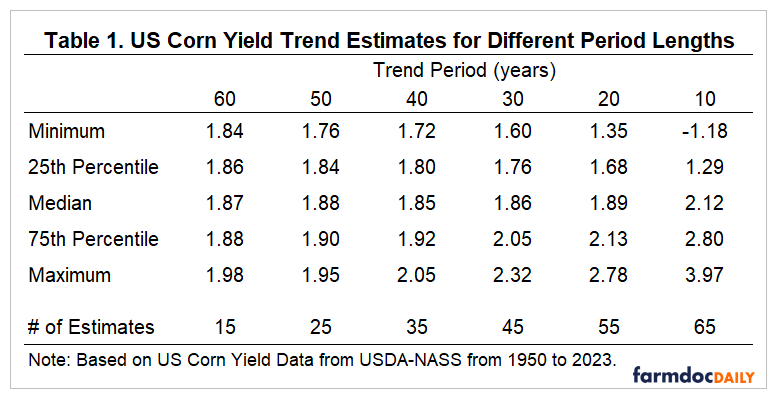
As the trend period length is further reduced in 10 year increments down to 20-years, the range and variability in trend estimates continues to increase while the median trend estimate remains relatively stable between 1.85 and 1.89 bu/acre/year.
The final column of table summarizes estimates for 10-year trend estimates. The 65 10-year periods since 1950 produce simple linear trend estimates which range from -1.18 to 3.97 bu/acre/year with a median value of 2.12.
Figure 2 provides “box and whisker” plots for the trend estimates for each of the trend period lengths considered and further highlights the increased variability in trend estimates as the trend period length is reduced.
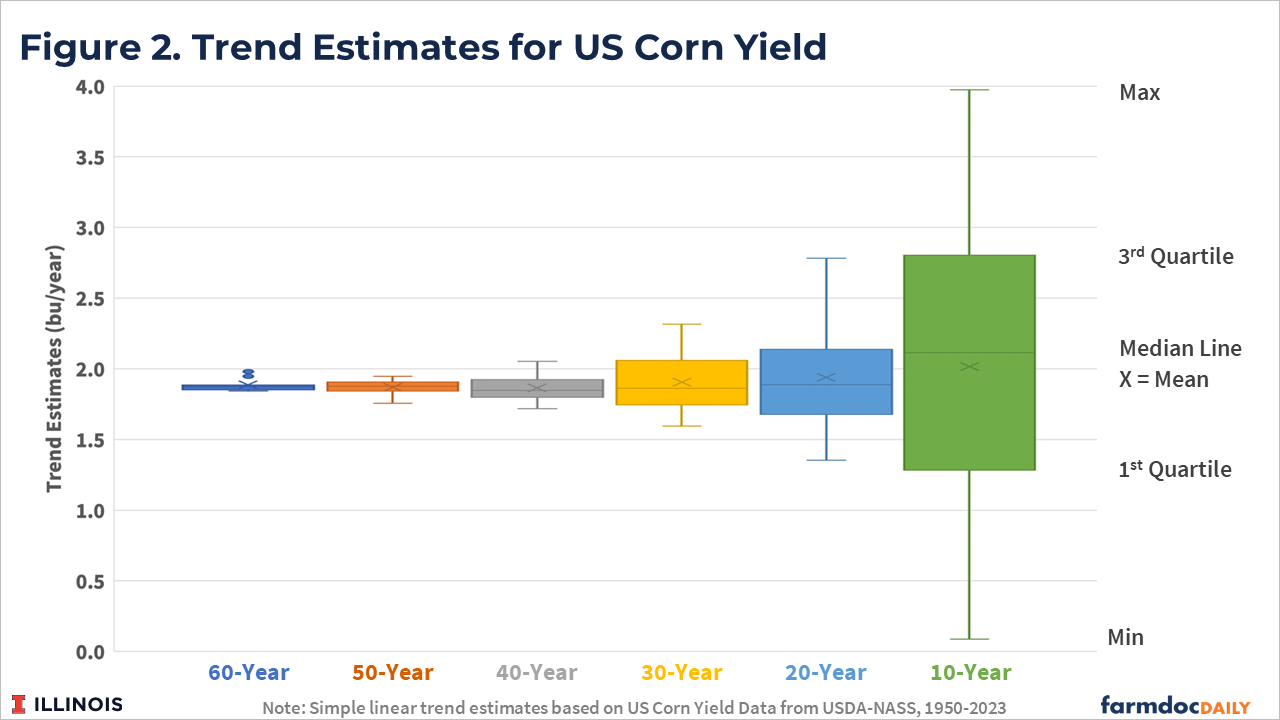
The interquartile range (IQR) of the trend estimates, represented by the size of the boxes in Figure 2, provides one way to compare the variability in trend estimates across the period lengths. The IQR for the 20-year trend estimates is just 30% that of the 10-year estimates. Moving to longer trend periods continues to reduce the IQR, or variability in trend estimates, but by smaller relative amounts.
Discussion
The comparison of trend estimates that come from different trend period lengths raises the question – what is the correct or appropriate amount of data to use when estimated yield trend? This is a difficult question to answer.
Longer periods will tend to provide less variable trend estimates as they are less impacted by individual yield outcomes within the series. However, this also means that the impact of any shocks which might structurally alter yield trends moving forward will be muted by the large number of historical yields in estimating the trend. Examples might include major technological advances, such as the rapid adoption of synthetic fertilizer use in the early 1950s which accelerated the yield growth experienced over the first half of the 20th century, or the impacts of climate change which recent modeling efforts suggest could shift the future path of yield growth experienced over the past 70 years.
Shorter periods arguably adapt to more current conditions impacting yield growth more quickly, but are also prone to more variation driven by yield experience and growing conditions in individual years during the trend period.
Figure 3 provides another visualization of the effect of period length on trend estimates by plotting the 10-, 30-, and 50-year trend estimates through time. The 10-year trend estimate series begins in 1959 and is based on US corn yields from 1950 to 1959, with each estimate after that being based on the most recent 10-year period. The 30-year series begins in 1979 and is based on US corn yields from 1950 to 1979, with each estimate after that being based on the most recent 30-year period.
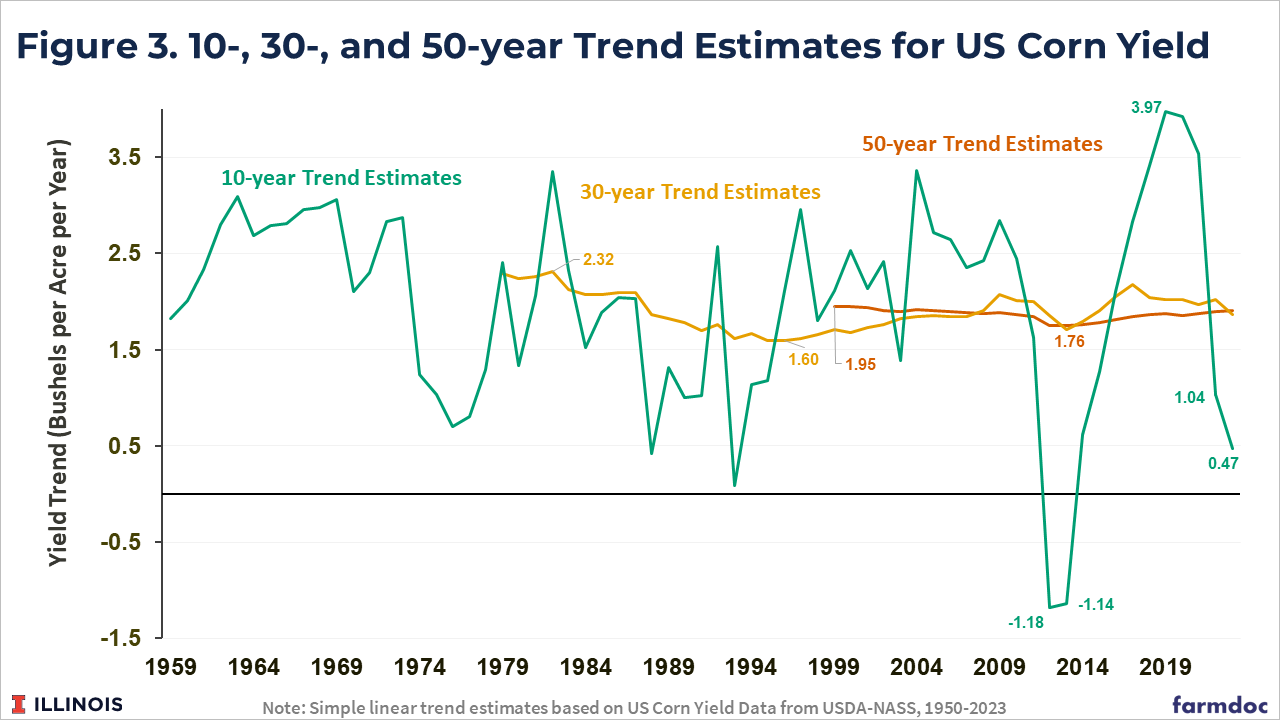
As extreme examples, consider the 10-year trend estimates of -1.18 for 2012 (based on data from 2003 to 2012) and -1.14 for 2013 (based on data from 2004 to 2013). These 10-year trend estimates are highly impacted by the poor corn yields during the major drought year of 2012 towards the end of those 10-year periods. Similarly, some of the largest 10-year trend estimates exceeding 3.5 bu/acre/year (from 2018 through 2021) result from the periods where the 2012 corn yield occurred during the early part of the 10-year period along with generally excellent corn yields from 2016 through 2018 at the end of those 10-year periods.
Less extreme examples include the 10-year periods impacted by individual yield variability resulting in trend estimates below even the 20-year trend estimate minimum of 1.35 bu/acre/year or above the 20-year trend estimate maximum of 2.78 bu/acre/year. Specifically, nearly 30% of the 10-year trend estimates are below 1.35, while almost 25% are above 2.8.
Finally, the trend estimates based on the two most recent 10-year periods (2013 to 2022 and 2014 to 2023) are 1.04 and 0.47 bu/acre/year, respectively. Both trend estimates are well below the minimum trend estimates for any of the longer trend period lengths, driven by the relatively good yields from 2014 to 2018 and relatively poor US corn yields since 2019.
Is this recent yield experience evidence of a major slowdown in US corn yield growth, or simply another example of the yield variability that can occur over a 10-year time period that has occurred multiple times in the US corn yield data since 1950? These are important questions given the role of yield growth in maintaining the global competitiveness of U.S. crop production (see farmdoc daily from March 20, 2024).
Conclusions
Estimates based on simple linear trends fit to historical data are commonly used to project future crop yields or to assess historical yield performance against expectations. Estimates of yield trend can be highly sensitive to the choice of data upon which they are based.
Longer time periods provide more stable results less prone to highly variable yields in a small number of years but will also be slow to adjust to structural changes such as the potential impact of climate change. In contrast, shorter time periods may adjust more quickly but will be prone to bias from yield variability in individual years.
US corn yield data since 1950 shows that 10-year trend estimates can vary considerably and potentially result in misleading conclusions regarding future yield growth. Increasing to 20-year periods significantly reduces the variability in historical trend yield estimates compared with 10-year trends while also allowing for more rapid adjustment to current conditions. Longer trend periods (30-year up to 60-year) continue to reduce variability in trend estimates but also reduces the ability for trend estimates to adjust over time.
The choice of an appropriate trend length is difficult. Historical US corn yield data since 1950 suggest corn yields have increased at a linear rate of around 1.9 bushels per acre per year over that timeframe. However, variability in yields across individual yields can lead to highly variable, and potentially misleading, yield trend estimates if they are based on periods less than 20-years in length. In future articles we plan to provide comparisons of how the variation in yield trend estimates can result in different expectations for future yield forecasts.
References
Irwin, S. "Should We Have Been Surprised by the U.S. Average Yield of Corn in 2023?" farmdoc daily (14):68, Department of Agricultural and Consumer Economics, University of Illinois at Urbana-Champaign, April 8, 2024.
Paulson, N., G. Schnitkey and C. Zulauf. "Impacts of Corn Acreage Increases on National Corn Yields." farmdoc daily (14):59, Department of Agricultural and Consumer Economics, University of Illinois at Urbana-Champaign, March 26, 2024.
Zulauf, C., J. Colussi, N. Paulson and G. Schnitkey. "Exploring Yield Growth: US Crops in a Global 21st Century Context." farmdoc daily (14):56, Department of Agricultural and Consumer Economics, University of Illinois at Urbana-Champaign, March 20, 2024.
Zulauf, C., G. Schnitkey, N. Paulson and J. Colussi. "World and Regional Trend Crop Yields in an Era of Climate Change." farmdoc daily (13):221, Department of Agricultural and Consumer Economics, University of Illinois at Urbana-Champaign, December 6, 2023.
Disclaimer: We request all readers, electronic media and others follow our citation guidelines when re-posting articles from farmdoc daily. Guidelines are available here. The farmdoc daily website falls under University of Illinois copyright and intellectual property rights. For a detailed statement, please see the University of Illinois Copyright Information and Policies here.