


Trends in General Inflation and Farm Input Prices
Recent articles have examined the increases in energy and fertilizer prices since early March (Arita et al., 2026; Paulson et al., 2026). This article takes a step back by examining longer term trends in general rates and agricultural input prices. In addition to demand and supply shocks, input prices for agricultural producers are affected by changes in general inflation. During the 1973 to 2025 period the average annual increase for the implicit price deflator for personal consumption expenditures and the USDA agricultural price index for production items were 3.4% and 4.1%, respectively. The correlation between the annual rates for these two indices was 0.59 over this period.
Long-Term Relationships
Before discussing long-term relationships between general inflation and farm input prices, it is important to define key terms. Inflation represents the decline in purchasing power of a currency over time (Investopedia, 2022). Quantitative estimates of the rate of inflation are typically made by examining the increase or decrease in the price levels of a basket of selected goods. Inflation measures include the consumer price index and implicit price deflators. Though computed using different methodologies, inflation measures are highly correlated over time. Most economists would agree that an increase in the supply of money is the root cause of inflation. Inflation mechanisms can be classified into three types: demand-pull inflation, cost-push inflation, and built-in inflation (Investopedia, 2022). When an increase in the money supply increases overall demand more than the productive capacity of an economy, we have demand-pull inflation. When production costs increase prices, we have cost-push inflation. Quality improvements and technological change are often incorporated into cost-push inflation. Quality improvements would increase prices while technological change tends to reduce prices. Finally, when individuals expect current inflation rates to continue in the future, we have built-in inflation. In general, the longer above average inflation rates persist, the more important built-in inflation becomes. All three of these types of inflation mechanisms have contributed to the inflation we have witnessed in the last couple of years.
Input price changes in agriculture and other industries are due to general inflation and its mechanisms as well as supply and demand fundamentals specific to a particular input. Having said that, some inputs are more closed aligned or correlated with general inflation than other inputs.
Using information for the 1973 to 2025 period from the Federal Reserve Bank of St. Louis on inflation rates and farm input price indices from USDA-NASS, we examined the correlation between the implicit price deflator for personal consumption expenditures and agricultural production items (i.e., aggregate input price index for production agriculture), feed, seed, fertilizer, fuels, labor, and machinery. The correlation coefficient between the implicit price deflator and agricultural production items was 0.59. The average annual rate of change for agricultural input prices over the period was higher (4.1 percent) than the rate of change for the implicit price deflator (3.4 percent). The average annual price changes for labor (4.5 percent) and machinery (5.5 percent) were significantly higher than the average increase in the implicit price deflator. In terms of the six specific input categories examined, the only correlation between the implicit price deflator and a specific input price change that was not significantly different from zero was the correlation between the implicit price deflator and feed prices. The correlations between the implicit price deflator, and labor and machinery were relatively higher than the correlation between the implicit price deflator and general farm price index (i.e., agricultural production items). This is an important result because it suggests that input prices for labor and machinery more closely follow trends in general inflation than input prices for items such as feed, seed, fertilizer, and fuels.
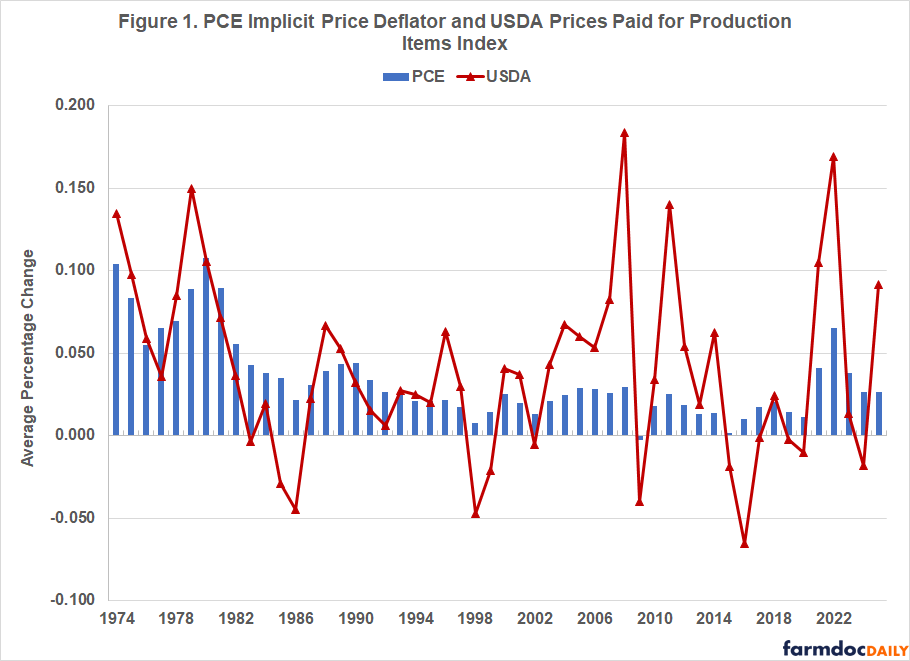
Figure 1 illustrates rates of change for general inflation and agricultural input prices from 1974 through 2025. Agricultural input prices appear to be substantially more variable than general inflation rates. General inflation was above 10% in 1974 and 1980. In contrast, the rate of change for agricultural input prices was above 10% in 7 years and above 15% in 2008 and 2022. Moreover, rates of change for agricultural input prices were negative in 13 of the years since 1974 while general inflation was not negative in any of the years since 1974. Relative variability can be measured using the coefficient of variation which is computed by dividing the standard deviation by the average. The coefficient of variation for the rate of change in agricultural production items was 81 percent higher than the coefficient of variation for the implicit price deflator. The coefficients of variation for feed, seed, fertilizer, and fuels were higher than the coefficient of variation for the more general farm input price index (i.e., agricultural production items). The coefficient of variation for the input price index for labor was smaller than the coefficient of variation for general inflation.
Historical Trends in General Inflation and Farm Input Prices
This section compares the 1-year, 5-year, and 10-year averages for the implicit price deflator for personal consumption expenditures and farm input prices. Data for the implicit price deflator were obtained from the Federal Reserve Bank of St. Louis. Except for fertilizer and diesel, data for farm inputs were obtained from USDA-NASS. Fertilizer and diesel price data were obtained from USDA-AMS (i.e., Illinois Production Report).
Table 1 presents the average price changes for general inflation, measured using the implicit price deflator for personal consumption expenditures, and farm inputs for 2025, for the 2021 to 2025 period, and for the 2016 to 2025 period. The first thing that becomes immediately apparent is how much lower inflation was in 2025 compared to the 5-year average. General inflation in 2025 was similar to the 10-year average. The rate of change for agricultural production items in 2025 was almost four times higher than the rate of inflation. The 10-year average for this item was 3.1%, slightly higher than the 10-year average for general inflation.
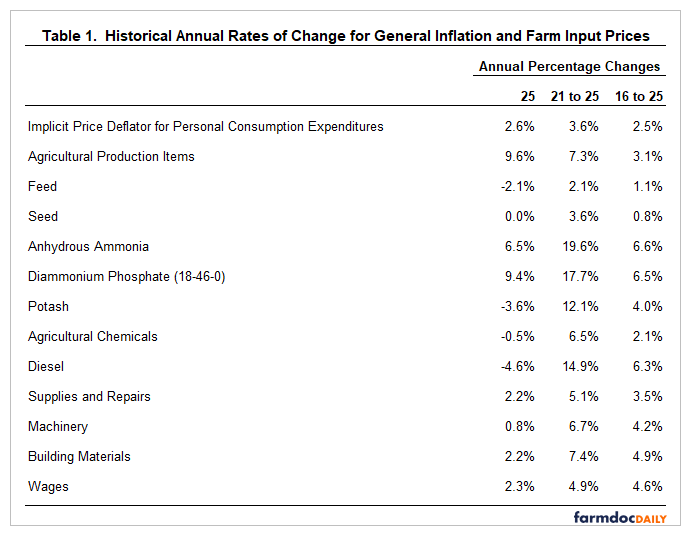
Now let’s compare the general inflation to individual farm input price changes. For the annual change from 2024 to 2025 (labeled 2025 in Table 1), the input price changes for anhydrous ammonia and phosphorus were higher than the annual change in the implicit price deflator or general inflation. For the 2021 to 2025 period, all agricultural inputs illustrated in Table 1 except for feed and seed had higher rates of change than general inflation. Turning to the 10-year averages, feed, seed, and agricultural chemicals had rates of change lower than general inflation. The 10-year input price increases for anhydrous ammonia, phosphorus, and diesel exceeded 5 percent, which was more than double the annual rate of change in general inflation.
Recent Trends in General Inflation and Farm Input Prices
Figure 2 illustrates average input prices for the latest 12 months for which data were available (i.e., February 2025 to February 2026). Data for February 2026 for the implicit price deflator was not available, so data for rate of change for the January 2025 to January 2026 period were used for this variable. The percentage change in the implicit price deflator was 2.8 percent. This is down sharply from the annual average in 2021, 2022, and 2023 (i.e., 4.1 percent, 6.3 percent, and 3.7 percent, respectively), but was similar to the 10-year average. The aggregate input price index for all production items input price was 10.6% year to year. In addition to fertilizer, the large price increase for purchased feeder livestock contributed to the large year-to-year change in the aggregate input price index. There was a lot of variability in individual agricultural input prices. Nitrogen, phosphorus, potash, supplies and repairs, and building materials had higher input price changes than general inflation while the rest of inputs illustrated in Figure 2 had lower relative price changes. The results in Figure 2 can be used to help explain why the breakeven prices for corn and soybeans did not decline in the last year.
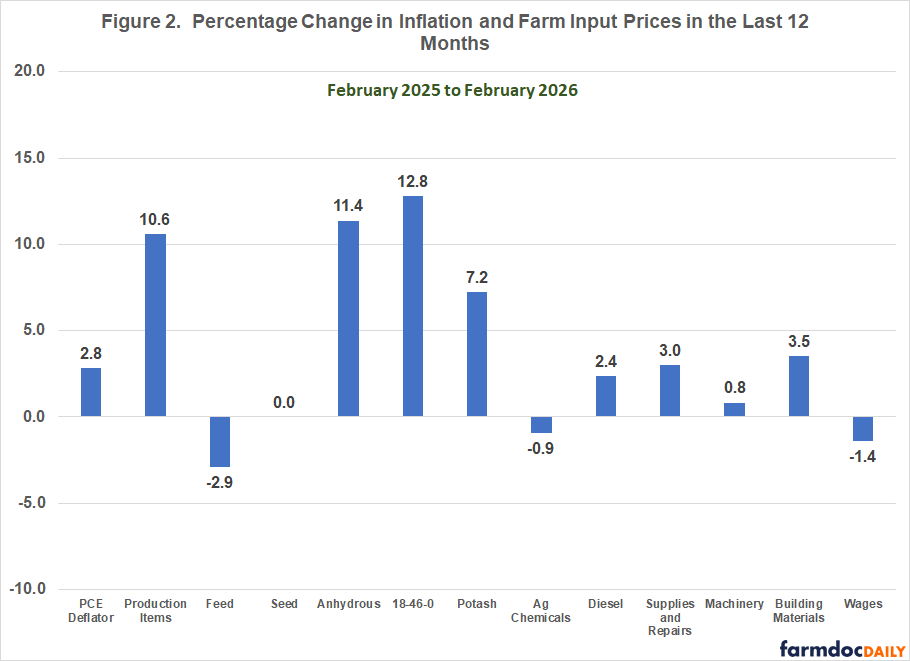
Figure 2 examined price changes from February 2025 through February 2026. Fuel and nitrogen prices have been very volatile in the last month. Using Illinois Production Reports in March, diesel price increased approximately 34% and anhydrous ammonia increased approximately 13% in March putting upward pressure on 2026 breakeven prices. The recent increases in energy and nitrogen prices may have an impact on 2026 acreage decisions.
Concluding Comments
This article discussed trends in general inflation and farm input prices. Over long periods of time, farm input prices are significantly correlated with general inflation. However, farm input prices are by no means perfectly correlated with general inflation. Each input has its own supply and demand fundamentals. Farm input price indices for machinery and labor were more correlated with general inflation than feed, seed, fertilizer, and fuels.
For the input price categories examined, the rates of change from February 2025 to February 2026 were substantially above general inflation for nitrogen, phosphorus, and potash. The anhydrous ammonia price was 11% higher in February 2026 than it was a year earlier. The price of anhydrous ammonia increased another 13% in March. Compared to March 2025, the price of anhydrous ammonia was 23% higher in March 2026. Higher input prices will impact 2026 breakeven prices and acreage decisions.
References
Arita, S., R. Chakravorty, J. Kim, W. Lwin and S. Steinbach. "Strait of Hormuz Closure and Fertilizer Supply Risks for U.S. Agriculture." farmdoc daily (16):48, Department of Agricultural and Consumer Economics, University of Illinois at Urbana-Champaign, March 23, 2026.
Federal Reserve Bank of St. Louis. FRED Economic data, accessed on March 31, 2026. https://fred.stlouisfed.org/
Fernando, J., M.J. Boyle, and P. Rathburn. “Inflation.” Investopedia, Updated January 12, 2022. https://www.investopedia.com/terms/i/inflation.asp
Paulson, N., G. Schnitkey, H. Monaco and C. Zulauf. "Nitrogen Prices Remain in Focus After Iran Conflict." farmdoc daily (16):49, Department of Agricultural and Consumer Economics, University of Illinois at Urbana-Champaign, March 24, 2026.
USDA-AMS. Illinois Production Reports, accessed on March 31, 2026. https://mymarketnews.ams.usda.gov/viewReport/3195
USDA-NASS. Quick Stats, accessed on March 31, 2026. https://quickstats.nass.usda.gov/
Disclaimer: We request all readers, electronic media and others follow our citation guidelines when re-posting articles from farmdoc daily. Guidelines are available here. The farmdoc daily website falls under University of Illinois copyright and intellectual property rights. For a detailed statement, please see the University of Illinois Copyright Information and Policies here.