


Comparing Corn Production Costs and Returns in the United States and Brazil
Brazil’s expansion in corn production over the last decade has made the country a more important competitor in global corn markets, increasing competitive pressure for U.S. producers. Although the United States remains the world’s largest corn producer by a wide margin, Brazil has become a more prominent competitor mainly due to the growth of second-crop corn planted after soybeans. This production system enables Brazilian farmers to spread fixed costs across two crops in the same year, resulting in a cost structure that differs from that of U.S. corn farms. Using standardized economic data from the agribenchmark network, this article compares corn production costs and returns in the United States and Brazil from 2020 to 2024. The analysis examines key differences in cost structures and profitability, providing insight into the factors affecting corn competitiveness in both countries.
Methods and Data
Corn competitiveness is analyzed using data from one typical farm in Iowa, United States, and one in Mato Grosso, Brazil – major corn-producing regions in their respective countries. The United States and Brazil account for 43% of global corn production and almost 60% of global corn exports (USDA, 2026). The study period, from 2020 to 2024, includes two major market shocks: the COVID-19 pandemic and the Russia–Ukraine war. The average area planted to corn over this period was 5,900 acres on the Brazilian farm and 1,800 acres on the U.S. farm. Costs and revenues are expressed in U.S. dollars to enable direct cross-country comparisons.
The data comes from the agribenchmark network, which systematically compiles production and economic information on beef, cash crops, dairy, pigs, poultry, horticulture, and organic enterprises across 35 countries in North America, South America, Europe, Asia, and Oceania. The agribenchmark concept of typical farms was developed to facilitate the analysis and comparison of prevailing farm production systems worldwide. Participants follow standardized procedures to construct typical farms that reflect national production shares and are classified by production systems, enterprise combinations, and structural characteristics (see farmdoc daily, January 8, 2024).
Corn Input Cost Shares
As with soybeans, differences in corn input use and production costs across farms in the United States and Brazil reflect variation in technology adoption, input prices, soil fertility, production efficiency, trade policies, exchange rate dynamics, labor availability, and market conditions (see farmdoc daily, February 23, 2026). Figure 1 presents the input cost shares for each farm, categorized into three major groups: direct costs, operating costs, and overhead costs. Direct costs include seed, plant protection, fertilizer, irrigation, crop insurance, drying costs, and finance costs. Operating costs comprise machinery costs, labor costs (both hired labor and family labor), contractor costs, fuel, and other energy expenses. Overhead costs consist of land, building depreciation, repairs and interest, property taxes, insurance, and miscellaneous expenses.
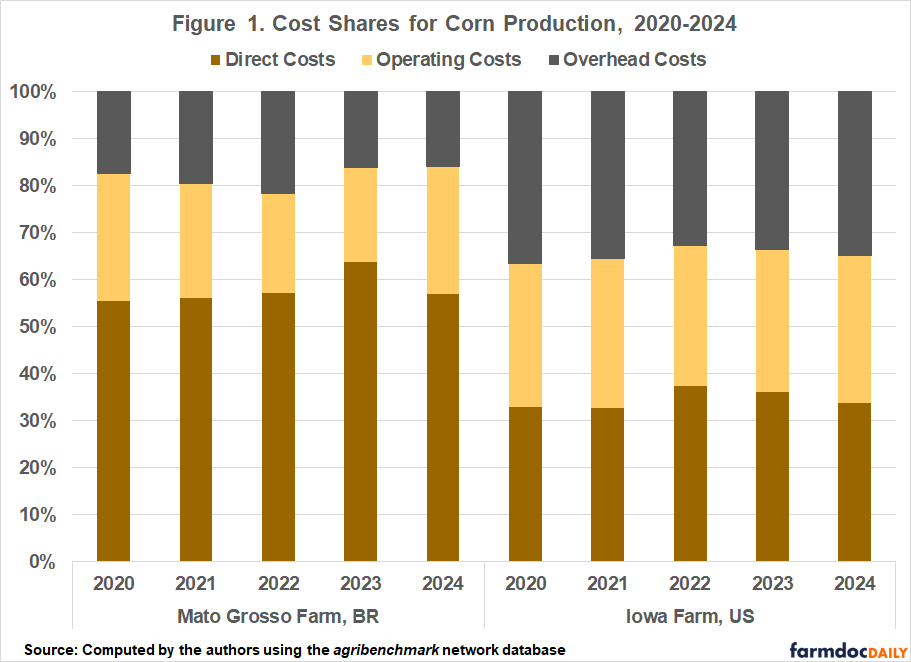
Direct costs dominate the typical Brazilian corn farm, accounting for more than 50% of total costs in every year analyzed. This reflects Brazil’s high input expenditures, especially for fertilizer. Corn is particularly dependent on nitrogen, whose prices rose significantly after 2022 due to disruptions related to the Russia-Ukraine war. Brazil is also heavily dependent on nitrogen imports, which supply nearly 95% of the country’s consumption (see farmdoc daily, April 20, 2026). In addition, almost 80% of Brazilian corn is produced as a second crop in the Cerrado region (Conab, 2026), where chemical pest control and fertilizer used to correct soil deficiencies represent a large share of production costs.
Meanwhile, for the typical U.S. farm, overhead costs accounted for the largest share of total production costs in three of the five years analyzed, representing more than one-third of total costs. This large share primarily results from land values appreciated, contributing to higher land costs over the last few years (Purdue University, 2025). The exceptions were 2022 and 2023, when direct costs exceeded overhead costs mainly due to historically high fertilizer prices. Higher fertilizer prices and supply shortages from late 2021 through the second quarter of 2022 due to the Russia–Ukraine conflict resulted in record fertilizer expenditures per acre in many countries. Even though operating costs represented a smaller share of total costs – less than 30% – they were higher in the United States than in Brazil during the analyzed period.
Corn Production Costs, Gross Revenue, and Economic Profits
Figure 2 presents production costs and gross revenue for corn on typical farms in Iowa and Mato Grosso. Overall, total costs were consistently higher on the U.S. farm than on the Brazilian farm over the 2020–24 period. From 2020 to 2024, total production costs on the Brazilian farm more than doubled, rising from $69 per ton to $147 per ton (see Figure 2). The sharp increase was largely attributable to rising direct costs, as higher international prices for imported fertilizers substantially increased production expenses. Because these inputs are priced in U.S. dollars, the depreciation of the Brazilian real against the dollar further amplified domestic costs over the same period.
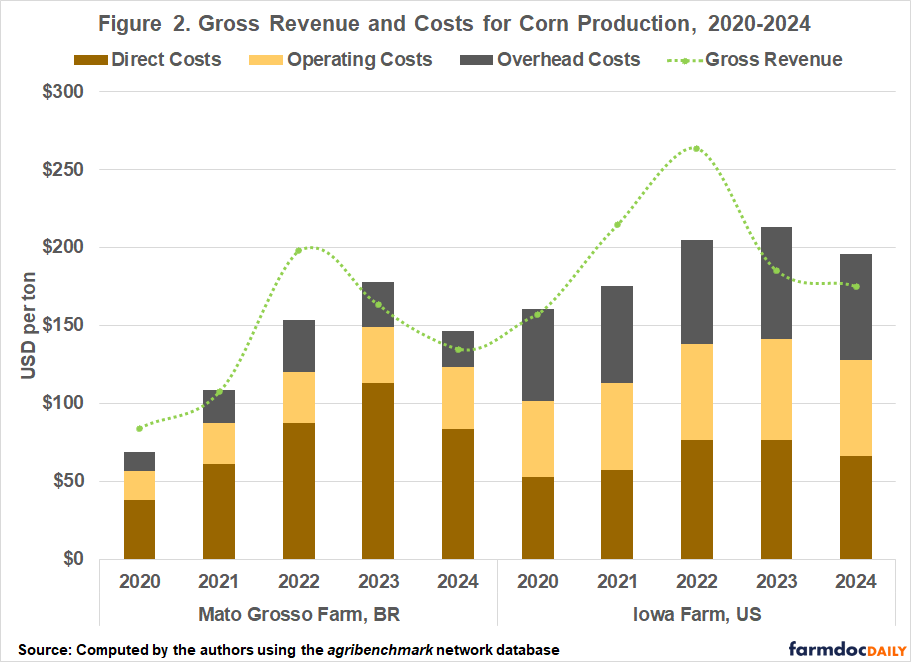
Corn production costs also increased on the U.S. farm, but at a slower pace than in Brazil. From 2020 to 2024, total production costs on the U.S. typical farm rose by 22%, from $160 per ton to $195 per ton (see Figure 2). In addition to appreciation in farmland values, operating costs on the typical U.S. farm increased by 26% during the period, from $49 per ton in 2020 to $62 per ton in 2024. Since 2021, all major components of operating costs in the United States – hired labor, family labor, contractors, machinery, and diesel – have risen substantially due to supply chain disruptions following the pandemic and inflationary pressures (USDA-ERS, 2024).
While total corn production costs increased across the typical farms analyzed during the 2020–2024 period, gross revenue also rose in both the United States and Brazil, although not always enough to offset higher costs. Figure 3 illustrates the resulting economic profits from corn production in both countries, calculated as the difference between gross revenue and total production costs (direct, operating, and overhead costs) for the typical farms in Iowa and Mato Grosso.
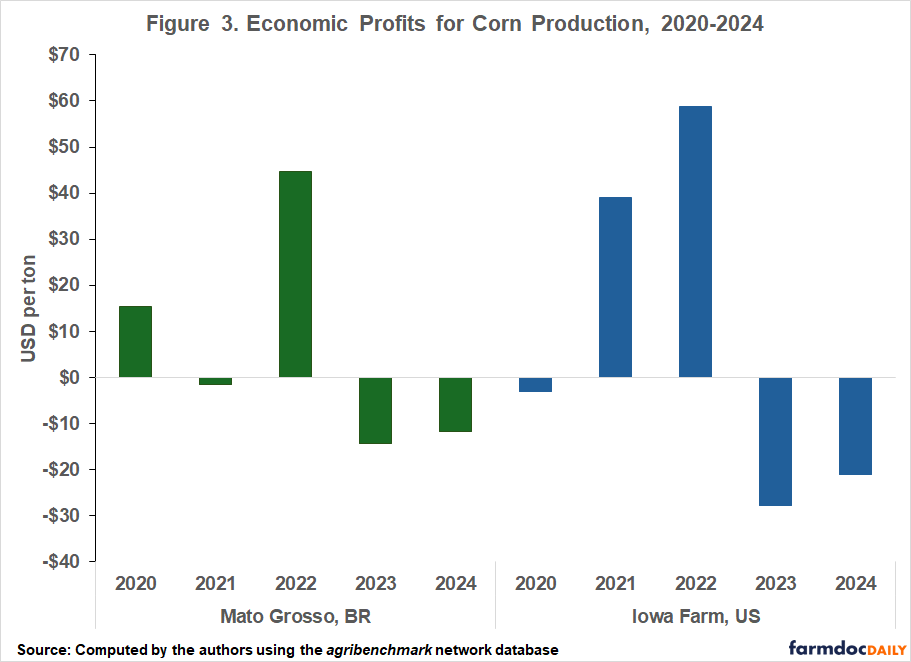
Economic profits varied across years and between the two farms. Both farms recorded their highest profits in 2022, when Chicago corn futures prices exceeded $6 per bushel. The Iowa farm reached $60 per ton, while the Mato Grosso farm achieved an economic profit of about $45 per ton. However, profits declined significantly after 2022. In 2023 and 2024, both farms reported negative economic profits, indicating that total revenue was not sufficient to cover total economic costs. The decline was greater for the Iowa farm, which posted losses of $28 per ton in 2023 and $21 per ton in 2024, compared with losses of $14 per ton and $12 per ton, respectively, for the Mato Grosso farm.
The larger decline in profits for the Iowa farm reflects the cost structure of U.S. corn production, where overhead costs such as land, capital recovery, and machinery ownership represent a large share of total costs and adjust slowly when commodity prices fall. The role of second-crop corn production in Brazil also helps explain the differences in profitability between the two farms. In Mato Grosso, corn is typically planted as a second crop after soybeans, allowing land and some machinery-related costs to be spread across two crops within the same production year (see farmdoc daily, March 12, 2024).
Final Considerations
This article shows that corn competitiveness in the United States and Brazil is affected not only by differences in production costs, but also by distinct production systems. The Iowa farm had higher total costs throughout the 2020–2024 period, largely reflecting higher overhead and operating costs, including land, machinery, labor, and capital-related expenses. In contrast, the Mato Grosso farm had lower total costs, but its cost structure was more heavily concentrated in direct inputs, especially fertilizers, and less concentrated in operating and overhead costs.
The role of second-crop corn in Brazil also helps explain these differences, as land and some machinery-related costs can be spread across soybeans and corn within the same production year. At the same time, second-crop corn is more exposed to production risk because planting occurs within a narrow window after soybean harvest and depends heavily on the timing and duration of seasonal rainfall. As a result, profitability in Mato Grosso is also influenced by the agronomic risks associated with second-crop production.
Although Brazil has become a more relevant competitor in global corn markets, supported by the expansion of second-crop corn and improvements in logistics, the United States continues to hold advantages in production scale and productivity. Unlike soybeans, where average yields in the two countries are similar, average U.S. corn yields are more than twice as high as Brazil’s, reflecting decades of specialization and highly developed production systems. Brazil’s growing competitiveness is driven more by the ability to expand corn acreage through second-crop production, spread some fixed costs across two crops, and produce corn at a lower total cost.
References
Agribenchmark. n.d. http://www.agribenchmark.org/home.html. Accessed on February 15, 2026.
Colussi, J. and M. Langemeier. "Middle East Conflict Revives Concerns Over Fertilizer Dependence in the U.S. and Brazil." farmdoc daily (16):68, Department of Agricultural and Consumer Economics, University of Illinois at Urbana-Champaign, April 20, 2026.
Colussi, J. and M. Langemeier. "U.S. and Brazil Soybean Competitiveness: Farm-Level Costs and Returns." farmdoc daily (16):29, Department of Agricultural and Consumer Economics, University of Illinois at Urbana-Champaign, February 23, 2026.
Colussi, J., N. Paulson, J. Janzen and C. Zulauf. “U.S. Dominance in Corn Exports on the Wane Due to Brazilian Competition”. farmdoc daily (14):50, Department of Agricultural and Consumer Economics, University of Illinois at Urbana-Champaign, March 12, 2024.
Conab, National Supply Company. Crops Time Series. Corn Production. Brasília, Brazil. May 2026.
Langemeier, M. "International Benchmarks for Corn Production." farmdoc daily (14):5, Department of Agricultural and Consumer Economics, University of Illinois at Urbana-Champaign, January 8, 2024.
Purdue University PAER 2025-08: Purdue Farmland Values and Cash Rents Survey results, Purdue Agricultural Economics Report, August 2025.
U.S. Department of Agriculture, World Agricultural Outlook Board. 2026. World Agricultural Supply and Demand Estimates. WASDE-671. Office of the Chief Economist, Washington, DC. May 12, revised May 13.
U.S. Department of Agriculture, Economic Research Service. 2026. Commodity Costs and Returns. U.S. Department of Agriculture, Washington, DC.
Disclaimer: We request all readers, electronic media and others follow our citation guidelines when re-posting articles from farmdoc daily. Guidelines are available here. The farmdoc daily website falls under University of Illinois copyright and intellectual property rights. For a detailed statement, please see the University of Illinois Copyright Information and Policies here.