


Rewriting the RFS Playbook: The Impact of Final RVOs on Projected Biomass-Based Diesel Feedstock Use for 2026-2027
The U.S. Environmental Protection Agency (EPA) finalized the “Set 2” rule at the end of March, establishing Renewable Volume Obligations (RVOs) under the Renewable Fuel Standard (RFS) for 2026 and 2027 that are unprecedented in the history of the program (farmdoc daily, April 16, 2026). We have been working through the implications of these historic RVOs for the U.S. biomass-based diesel industry across a series of articles. Most recently, we translated the required pace of D4 RIN generation into the physical volumes of domestic biomass-based diesel production and imports needed to meet the final RVOs, and found that doing so would require domestic plants to run at very high rates of capacity utilization while relying on a recovery in imports that has yet to materialize (farmdoc daily, June 10, 2026). Standing behind every physical gallon of biomass-based diesel is a corresponding requirement for feedstock—soybean oil, distillers corn oil, animal fats, used cooking oil, and canola oil. The purpose of this article is to project the feedstock use implied by our biomass-based diesel production and import projections for 2026 and 2027, focusing on the split between domestic and imported feedstock and soybean oil use.
Analysis
We begin by recapping the production and import projections developed in our previous article from June 10th. That analysis fixes domestic FAME biodiesel and renewable diesel production at the level implied by an assumed rate of capacity utilization—90 percent of operable capacity in 2026 and 95 percent in 2027—and then solves for the imports required to close the remaining gap relative to the required level of D4 RIN generation. Applying those utilization rates yields domestic production of 1.78 billion gallons of FAME biodiesel and 4.32 billion gallons of renewable diesel in 2026, for a total of 6.10 billion gallons of domestic biomass-based diesel; the comparable figures for 2027 are 1.88, 4.56, and 6.43 billion gallons. The residual met by imports is 0.60 billion gallons in 2026 and 1.30 billion gallons in 2027. Adding domestic production and imports, total biomass-based diesel supply rises from 4.25 billion gallons in 2025 to 6.70 billion in 2026 and 7.74 billion in 2027. These projections are summarized in Figure 1.
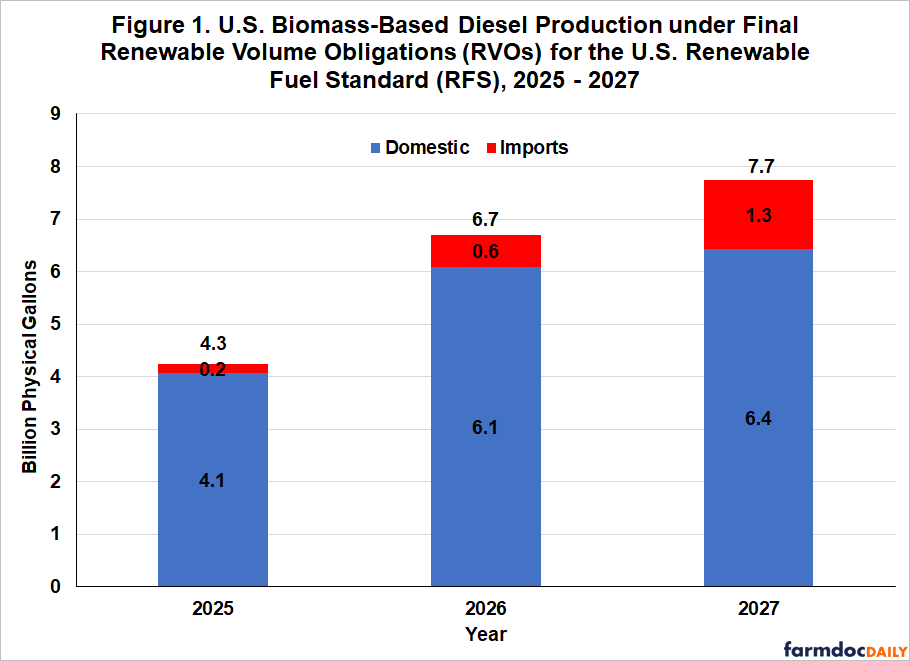
These are demanding annual figures relative to the recent pace of actual production. Reaching 6.10 billion gallons of domestic production in 2026 requires renewable diesel to run well beyond any monthly pace it has ever achieved and FAME biodiesel to run at roughly its best sustained pace on record, every month for two consecutive years, after utilization fell to about 60 percent as recently as 2025. On the import side, the required volumes are achievable by the standards of 2023 and 2024, but imports have nearly stopped under the 45Z clean fuel production credit, for which non-North American imported biofuels are not eligible. The key point here is that the annual production and import projections, if achieved, carry large feedstock requirements. Those annual requirements, rather than the monthly pace, are the focus of this article.
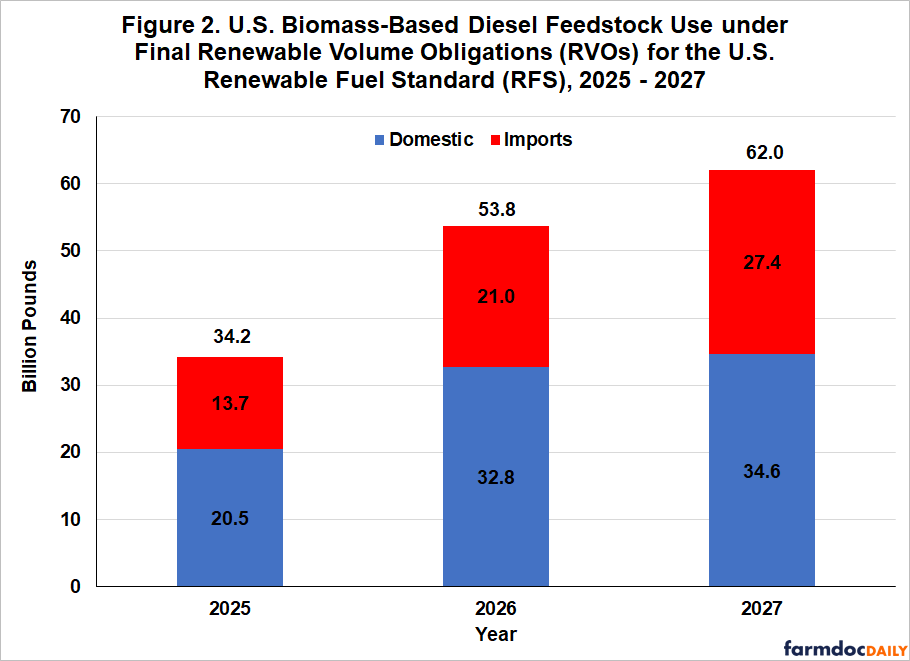
We translate the production and import projections into feedstock use following a similar approach as in our previous analysis of biomass-based diesel feedstock demand (farmdoc daily, November 12, 2025). Physical production is converted to feedstock at 7.55 pounds per gallon for FAME biodiesel and 8.25 pounds per gallon for renewable diesel. These rates imply an average of about 8.0 pounds of feedstock per gallon of biomass-based diesel, very close to the average computed from the EIA’s Monthly Biofuels Capacity and Feedstocks Update Report. Applying these rates to total biomass-based diesel supply—domestic production plus imports—gives total feedstock use of 53.8 billion pounds in 2026 and 62.0 billion pounds in 2027, compared with 34.2 billion pounds in 2025. Compared to 2025, this means that total feedstock use is projected to increase 57 percent in 2026 and 81 percent in 2027.
A key question is how much of this feedstock will be sourced domestically and how much will be imported. We split total feedstock use into domestic and imports in two steps. First, imported biomass-based diesel is by definition produced entirely from imported feedstock. Second, for domestic production, we assume that a fixed share of feedstock is met domestically and the remainder is imported. In its June 2025 analysis accompanying the proposed RVO rule, the EPA estimated that 81 percent of biodiesel feedstock and 56 percent of renewable diesel feedstock were sourced domestically in 2024. We raise these shares slightly to 85 percent for biodiesel and 60 percent for renewable diesel in 2026 and 2027. The higher domestic shares reflect the penalty that the 45Z credit imposes on feedstock imported from outside North America, which makes domestic feedstock relatively more attractive than it was under prior policy.
Figure 2 shows the resulting projections of total feedstock use, split into the domestic and import components. Domestic feedstock use increases from 20.5 billion pounds in 2025 to 32.8 billion in 2026 and 34.6 billion in 2027. Imported feedstock use increases from 13.7 billion pounds in 2025 to 21.0 billion in 2026 and 27.4 billion in 2027. Compared to 2025, domestic feedstock use is projected to increase 60 percent in 2026 and 69 percent in 2027. The same figures for imported feedstock are 53 percent in 2026 and 100 percent in 2027.
Even though we assume a slightly higher domestic feedstock share than in 2024, imported feedstock use is still very large in both 2026 and 2027. There are two reasons. First, biomass-based diesel imports are large in both years—0.60 billion gallons in 2026 and 1.30 billion in 2027—and as noted above imported fuel is made entirely from imported feedstock. Second, a large share of domestic renewable diesel capacity is configured to run on imported feedstock. Figure 3 maps the location of U.S. renewable diesel production capacity. About three-quarters of that capacity is located on or near the Gulf coast and the California coast. These large renewable diesel plants were sited deliberately to take advantage of imported feedstocks, particularly those with low carbon-intensity (CI) scores that earn credits under California’s Low Carbon Fuel Standard (LCFS). Their coastal location gives them ready access to imported feedstock by ship, and much of their business model was built around that access.

The final piece of the feedstock analysis is soybean oil, the single largest domestic feedstock for biomass-based diesel. Figure 4 splits the feedstock used in domestic biomass-based diesel production into soybean oil and all other feedstocks. We project soybean oil use at 37.5 percent of the total feedstock required for domestic production, the middle of the range for soybean oil in recent years (roughly 35 to 40 percent). On that basis, soybean oil use rises from 12.4 billion pounds in 2025 to 18.4 billion in 2026 and 19.4 billion in 2027. Use of this magnitude would absorb a sizable share of available domestic soybean oil supply and would have substantial implications for the soybean oil market and the broader fats and oils complex (Bukowski and Swearingen, 2026).
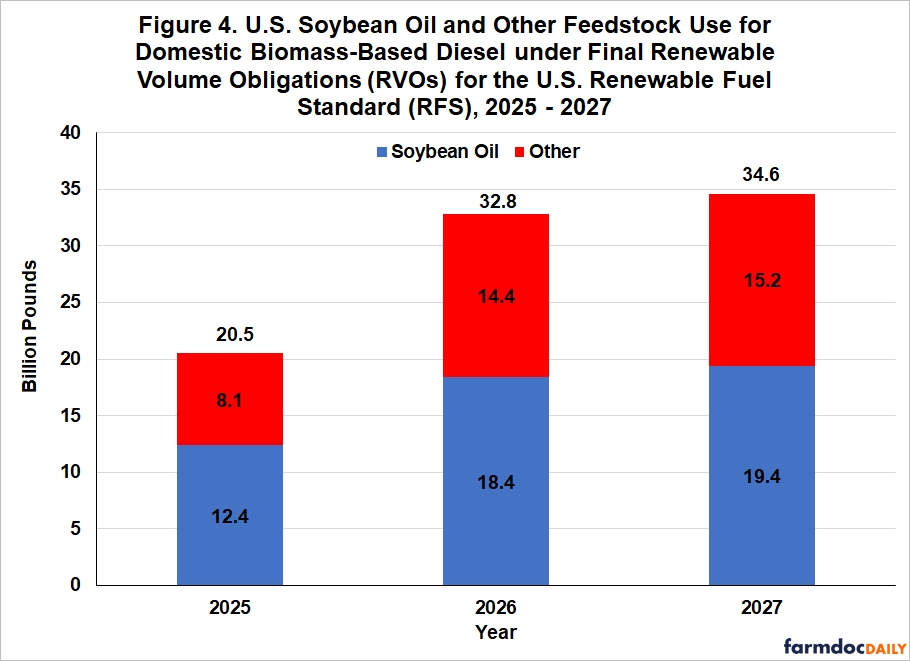
Soybean oil usage for the calendar year calculated in this exercise should not be confused with the marketing year calculations produced in industry and by the USDA that run from October through September. Also, the 2026 total of 18.4 billion pounds of soybean oil feedstock suffers from the same slow start discussed in our previous article on biomass-based diesel production. EIA data through March indicates soybean oil usage for biofuels in the first quarter of 3.32 billion pounds, well below the pace needed to meet 18.4 billion pounds during the year. Subsequent data on biomass-based diesel production in April and May indicate similar soybean oil consumption to the level seen in March. In other words, the amount of soybean oil on a monthly basis, by our calculations around 1.79 billion pounds a month, necessary to meet the 18.4 billion pounds calculated needs to pick up considerably.
These annual feedstock projections rest on a number of assumptions and are subject to several uncertainties. First, and most important, the projections inherit all of the uncertainty in the underlying production and import projections. The domestic production figures assume capacity utilization of 90 percent in 2026 and 95 percent in 2027, which are aggressive rates by the standards of the recent past. If production falls short of these levels—and the early-2026 pace suggests it could—feedstock use would be correspondingly lower.
Second, the split between domestic and imported feedstock depends on the assumed domestic feedstock shares of 85 percent for biodiesel and 60 percent for renewable diesel. The actual response of feedstock sourcing to the 45Z penalty on non-North American feedstock is not yet known. If domestic plants substitute toward domestic feedstock more aggressively than we assume, imported feedstock use would be lower and domestic use higher; if the substitution is more limited, the reverse holds.
Third, the level of biomass-based diesel imports is itself uncertain. We assume imports of 0.60 billion gallons in 2026 and 1.30 billion in 2027, but imports have nearly stopped under the 45Z credit, and it is not yet clear whether D4 RIN prices will rise enough to draw them back. Because imported fuel is made entirely from imported feedstock, lower imports would reduce imported feedstock use and shift more of the burden onto domestic feedstock—provided domestic production rises to fill the gap.
The trade uncertainties in these projections cannot be underestimated. The U.S. has historically imported large volumes of both finished renewable diesel and feedstock, particularly low-CI feedstocks such as used cooking oil and tallow that command premium prices under the LCFS. The 45Z credit upends the economics of those flows by denying eligibility to feedstock produced outside North America, but it does not tell us how importers and producers will respond. Imported feedstock could pull back sharply, or it could prove more resilient than expected if the LCFS premium on low-CI feedstock remains large enough to keep imports economic for fuel sold into the California market. Just as uncertain is how the mix of feedstocks will shift. A retreat from imported low-CI feedstocks would force greater reliance on domestic soybean oil, distillers corn oil, and animal fats, moving both our 37.5 percent soybean oil share and the domestic-versus-imported split in ways that are hard to predict. Layer on the broader uncertainty surrounding trade policy and tariffs, and the trade dimension is a large swing factor in these feedstock projections.
Implications
The final Set 2 RVOs imply a large increase in biomass-based diesel feedstock use in 2026 and 2027. Total feedstock use rises by 57 percent in 2026 and 81 percent in 2027 relative to 2025, with domestic feedstock use reaching 32.8 and 34.6 billion pounds and imported feedstock use reaching 21.0 and 27.4 billion pounds. Imported feedstock use under our assumptions remains large for two reasons. First, biomass-based diesel imports are sizable in both years and are, of course, made entirely from imported feedstock, and roughly three-quarters of domestic renewable diesel capacity sits on or near the Gulf and California coasts, where it was built to run on imported feedstock. Soybean oil use is projected to climb to 18.4 billion pounds in 2026 and 19.4 billion in 2027, which would absorb a substantial share of domestic soybean oil supply.
The defining feature of the 2026–2027 outlook is uncertainty about how the market will source feedstock on this scale, and it compounds across three layers: the split between domestic production and imported fuel, the division between domestic and imported feedstock under the 45Z penalty, and the distribution of the feedstock mix—soybean oil, tallow, UCO, distillers corn oil, and canola oil—within each channel. These layers interact, so a shortfall in one pushes demand into the others. The bottom line is that the final RVOs ask the sector to draw feedstock at a scale beyond anything in the recent record, while leaving genuinely open how the market will actually deliver these volumes across fuel imports versus domestic production, domestic versus imported feedstock, and the feedstock mix itself.
References
Bukowski, M., and B. Swearingen. “Special Article: Vegetable Oils and Fats Use for Biofuels Production is Forecast to Expand under Current U.S. Biofuels Policies.” Oil Crops Outlook, U.S. Department of Agriculture, Economic Research Service, Situation and Outlook Report, May 2026. https://ers.usda.gov/media/20879/ocs-26e.pdf?v=68086
Hubbs, T. and S. Irwin. “Rewriting the RFS Playbook: The Impact of Revised RVOs on Projected Biomass-Based Diesel Production and Feedstock Use for 2026-2027.” farmdoc daily (15):209, Department of Agricultural and Consumer Economics, University of Illinois at Urbana-Champaign, November 12, 2025.
Hubbs, T., and S. Irwin. “Rewriting the RFS Playbook: Final 2026–2027 RVOs for Biomass-based Diesel.“ farmdoc daily (16):66, Department of Agricultural and Consumer Economics, University of Illinois at Urbana-Champaign, April 16, 2026.
Hubbs, T., and S. Irwin. “Rewriting the RFS Playbook: The Impact of Final RVOs on Projected Biomass-Based Diesel Production and Imports for 2026-2027.“ farmdoc daily (16):101, Department of Agricultural and Consumer Economics, University of Illinois at Urbana-Champaign, June 10, 2026.
Disclaimer: We request all readers, electronic media and others follow our citation guidelines when re-posting articles from farmdoc daily. Guidelines are available here. The farmdoc daily website falls under University of Illinois copyright and intellectual property rights. For a detailed statement, please see the University of Illinois Copyright Information and Policies here.