


Rewriting the RFS Playbook: The Impact of Final RVOs on Projected Biomass-Based Diesel Production and Imports for 2026-2027
The U.S. Environmental Protection Agency (EPA) released the final “Set 2” rule establishing Renewable Volume Obligations (RVOs) under the Renewable Fuel Standard (RFS) for 2026 and 2027 at the end of March. The 2026 and 2027 increases in the biomass-based diesel RVOs are unprecedented in the history of the RFS and will set the trajectory of the U.S. biomass-based diesel industry for years to come (farmdoc daily, April 16, 2026). In our two most recent articles in this series (farmdoc daily, April 27, 2026; May 11, 2026), we used a detailed balance sheet approach to project the level of D4 RIN generation required to meet the final RVOs and then compared that requirement with the recent monthly pace of generation. The headline finding was that required D4 net RIN generation must increase from 7.10 billion RIN gallons in 2025 to 10.99 billion RIN gallons in 2026 and 11.89 billion RIN gallons in 2027—levels that have no precedent in the history of the U.S. biomass-based diesel industry. The purpose of this article is to translate the D4 RIN generation requirement into the physical terms that ultimately determine the levels of domestic FAME biodiesel and renewable diesel production, and the level of imports, needed to generate the required D4 RINs in 2026 and 2027.
Analysis
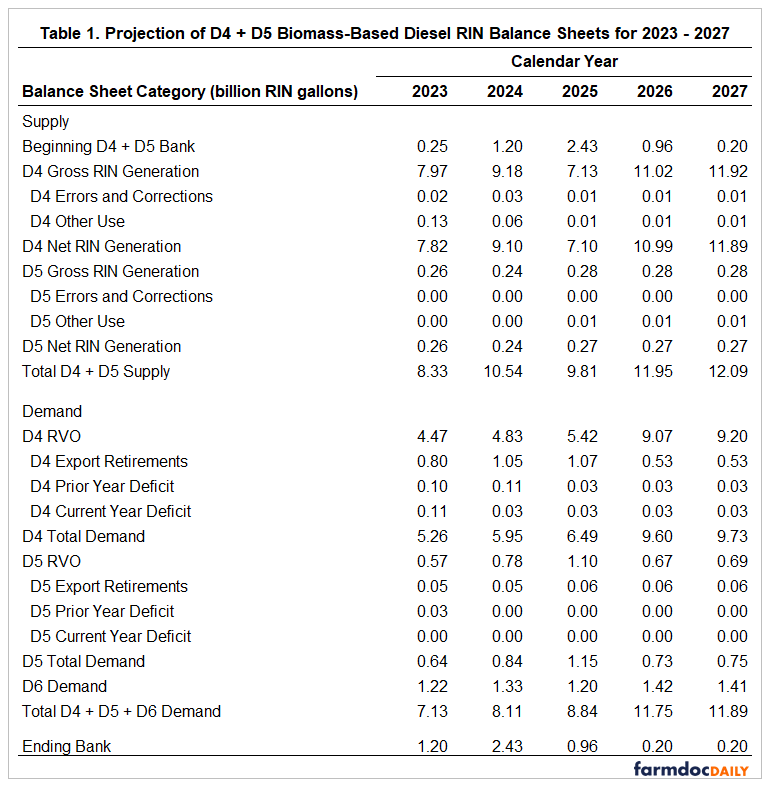
We begin with a brief recap of the D4/D5 RIN balance sheet analysis presented in our April 27th article. We construct the D4/D5 balance sheet using actual EPA data for 2023–2025 and projections for 2026–2027 based on the final Set 2 RVOs, an assumed minimum operating bank of 200 million gallons in both 2026 and 2027, and crucial cross-market linkages with the D6 conventional balance sheet. The balance sheet is reproduced in Table 1. D4 net RIN generation must rise from 7.10 billion RIN gallons in 2025 to 10.99 billion RIN gallons in 2026 and 11.89 billion RIN gallons in 2027, increases of 55 and 67 percent, respectively, relative to the actual level in 2025. Note that we project net D4 RIN generation, which is gross D4 RIN generation adjusted for the number of invalid RINs generated and other uses. In absolute terms, the 3.89-billion-RIN-gallon increase in D4 net generation between 2025 and 2026 alone is roughly four times the size of the 2025 D4/D5 ending bank of 960 million gallons. The demand structure underlying these required generation levels comprises three components: the biomass-based diesel applicable RVO of 9.07 billion gallons in 2026 and 9.20 billion in 2027; D4 export retirements of 534 million gallons in each year; and the D6 “pull”—the volume of biomass-based diesel RINs needed to satisfy the conventional fuel obligation when D6 ethanol RIN supply is insufficient—of 1.42 billion gallons in 2026 and 1.41 billion in 2027. The ending D4/D5 bank is projected to fall from 960 million gallons at the close of 2025 to the assumed minimum operating level of 200 million gallons by year-end 2026 and to remain at that level through 2027. In short, D4 net RIN generation is the crucial number that the biomass-based diesel sector must hit in each of the next two compliance years, and the cushion provided by the RIN bank is essentially exhausted after 2026.
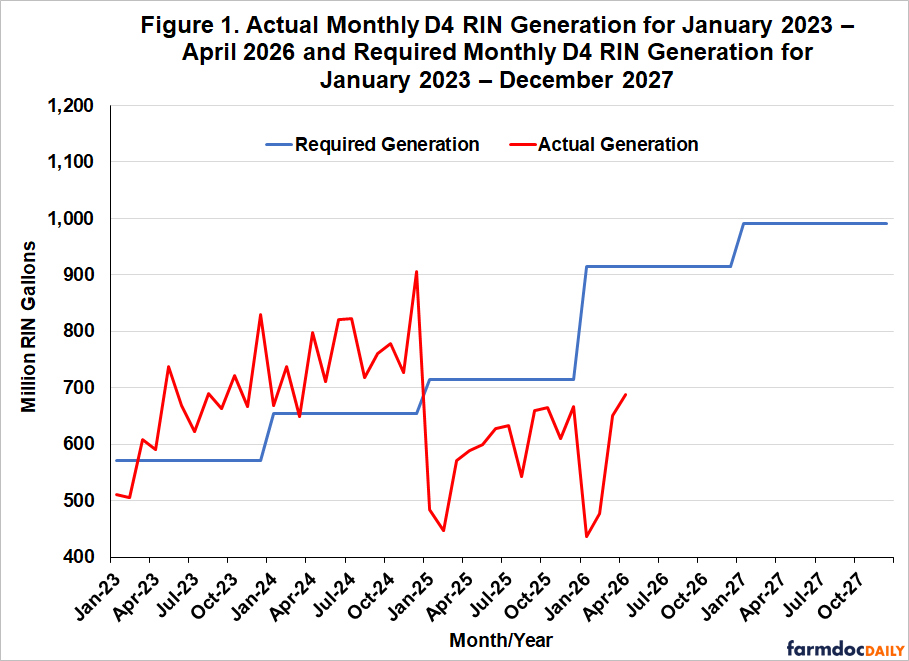
The challenge of meeting the projected D4 RIN net generation levels in 2026 and 2027 comes into sharp relief when set against the recent history of generation. Figure 1 shows the average monthly pace of D4 RIN net generation required to satisfy total D4 demand in each calendar year over 2023-2027 alongside actual monthly net D4 RIN generation from January 2023 through the latest data point, April 2026. Note that we define required net D4 RIN generation in 2023, 2024, and 2025 to be total D4 + D5 + D6 demand in Table 1 minus D5 net RIN generation. This definition of net D4 requirements is not impacted by variation in the RIN bank over this time, as D4 generation swung from over-supply and a huge buildup of the ending bank in 2023 and 2024 to under-production in 2025 and a drawdown of the bank. The required D4 RIN generation in 2026 and 2027 is the same as discussed above, 10.99 and 11.89 billion gallons, respectively, because the ending RIN bank does not vary under the assumptions used to derive the projections of D4 requirements. In all years, the monthly net D4 RIN generation requirement is simply the annual requirement divided by 12.
Figure 1 shows that the required monthly pace was 572 million RIN gallons in 2023, rose to 655 million RIN gallons in 2024, and increased further to 714 million RIN gallons in 2025. Under the final Set 2 rule, the required pace jumps to 916 million RIN gallons in 2026 and 991 million RIN gallons in 2027. Only one month over the 2023–2025 period—December 2024 at 906 million gallons—came anywhere close to the pace required for 2026 and 2027, and that single observation is widely understood to reflect a pull-forward of imports ahead of the expiration of the $1 per gallon blenders tax credit rather than sustained underlying supply. Monthly D4 RIN net generation in early 2026 has started off well below the pace needed to meet the 2026 RVO, registering 436 million gallons in January, 478 million in February, 651 million in March, and 688 million in April, with each below not only the 2026 requirement but also the required monthly average pace for 2025. Import levels in particular remain very low relative to 2024 because of the switch from the blenders tax credit to the 45Z clean fuel production credit, for which imported biofuels are not eligible. The cumulative shortfall through the first four months of 2026 is 1.411 billion RIN gallons relative to the pro-rata required pace, or about 13 percent of the entire annual requirement. Closing that early-year gap would require monthly D4 net RIN generation over the remaining eight months of 2026 to average 1.092 billion RIN gallons, a pace more than 20 percent above the highest single month ever recorded.
With the scale of the required D4 RIN generation established, we can turn to the physical production and imports that must stand behind it. The link between physical volumes and RIN generation is the D4 RIN equivalence value: FAME biodiesel generates 1.5 RINs per physical gallon, while renewable diesel—nearly all of which is produced through the HEFA process—historically generated 1.7 RINs per physical gallon (farmdoc daily, February 8, 2023). During 2026, renewable diesel still generates 1.7 RINs per gallon, however, the equivalence value changes in 2027 due to changes in the Set 2 final rulemaking. Renewable diesel equivalence values drop to 1.5 in 2027 unless producers procure approval for a 1.6 equivalence value from EPA. For our analysis, an assumption of an average 1.55 equivalence value of renewable diesel is assumed in 2027 as a base case scenario. Any given level of required D4 RIN generation can be met with different combinations of domestic FAME biodiesel, domestic renewable diesel, and imports, and we now estimate the combination implied by the final Set 2 RVOs.
Our approach is to fix domestic physical production at the level implied by an assumed rate of capacity utilization and then to solve for the imports required to close the remaining gap relative to the D4 RIN generation requirement. Specifically, we assume that domestic FAME biodiesel and renewable diesel plants operate at 90 percent of operable capacity in 2026 and 95 percent in 2027. These are high utilization rates by the standards of the recent past, and we adopt them deliberately. We assume that the final RVOs were set with the goal of requiring the U.S. domestic industry to run at close to maximum capacity, and our aim is to characterize what production looks like under an aggressive—but not physically impossible—operating assumption.
Figure 2 places these assumptions against the monthly record of operable capacity utilization for FAME biodiesel and renewable diesel from January 2021 through April 2026. FAME biodiesel utilization moved within a band of roughly 55 to 90 percent over 2021–2024, averaging 81.5 percent in 2023 and 83.1 percent in 2024, with individual months occasionally approaching 90 percent. Renewable diesel utilization was more variable, averaging 73.3 percent in 2023 and 69.6 percent in 2024, but it included a notable stretch in late 2021 when monthly utilization ran above 100 percent of operable capacity, reaching roughly 136 percent in December. Biodiesel and renewable diesel plants can and do operate above their rated nameplate capacity for several months at a time when margins and policy incentives line up. A sustained annual average of 90 to 95 percent is high, but it is consistent with what the industry has demonstrated it can accomplish over multi-month runs. This is corroborated by our discussions with industry contacts, who indicate that renewable diesel plants can run at least 10 percent over nameplate capacity for a number of months.
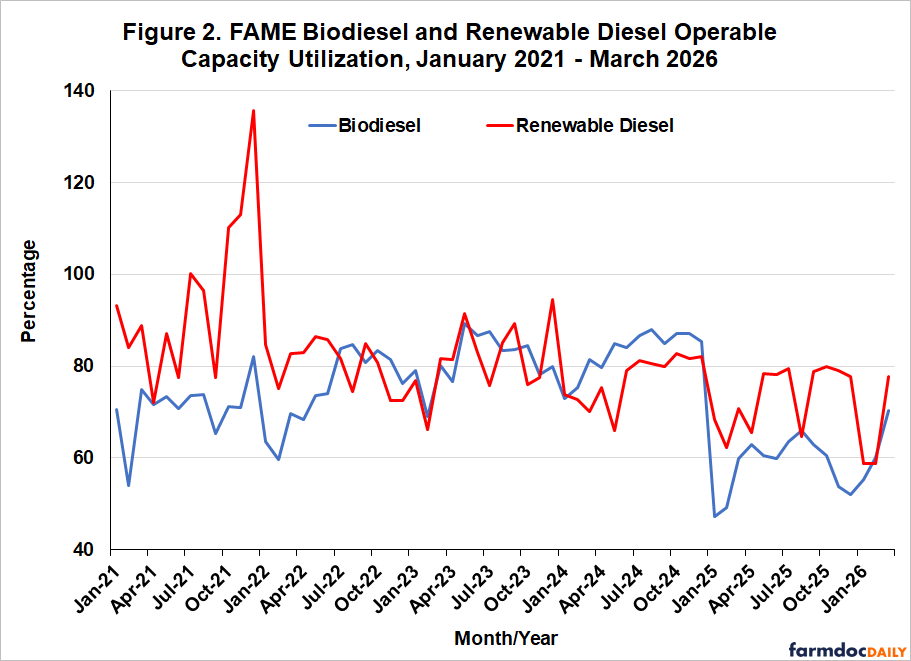
The contrast with 2025 in Figure 2 is sharp. As the sector absorbed the expiration of the blenders tax credit and the shift to 45Z, utilization collapsed: FAME biodiesel averaged 58.2 percent for the year and renewable diesel 60.8 percent, with FAME utilization falling below 50 percent in early 2025. Utilization remained depressed through the first quarter of 2026. Returning to a 90 percent annual average in 2026 therefore requires not merely sustaining a high rate but engineering a substantial rebound from current operating levels.
Applying these utilization rates to operable capacity of 1.98 billion gallons for FAME biodiesel and 4.80 billion gallons for renewable diesel yields domestic production of 1.78 billion gallons of FAME biodiesel and 4.32 billion gallons of renewable diesel in 2026, or 6.10 billion gallons of biomass-based diesel in total. At 95 percent utilization in 2027, the comparable figures are 1.88, 4.56, and 6.43 billion gallons. Converting these volumes to D4 RINs at the applicable equivalence values and comparing the result with the required D4 net generation from Table 1 leaves a residual that must be met by imports: roughly 600 million gallons of imported biomass-based diesel in 2026 and 1.30 billion gallons in 2027. To compare these annual projections with the monthly historical pace, we divide each annual figure by twelve to obtain an average required monthly pace and then set that required pace against the recent history of actual monthly production and imports in Figures 3 through 6.
Figure 3 compares the required monthly pace of domestic FAME biodiesel production with actual monthly production since January 2023. The required pace is 148 million gallons per month in 2026 and 157 million gallons in 2027. For perspective, actual FAME production averaged roughly 141 million gallons per month in 2023 and 139 million in 2024, and the single highest month on record over this period was about 155 million gallons, in May 2023. The 2026 requirement is essentially equal to the best month FAME biodiesel has posted in recent years, sustained across all twelve months of the year, and the 2027 requirement exceeds it. Measured against the recent record the gap is wider still: FAME production fell to an average of about 96 million gallons per month in 2025 and stood at just 91, 98, and 115 million gallons in January, February, and March 2026. Hitting the required pace implies roughly a 45 to 50 percent increase over the early-2026 rate.
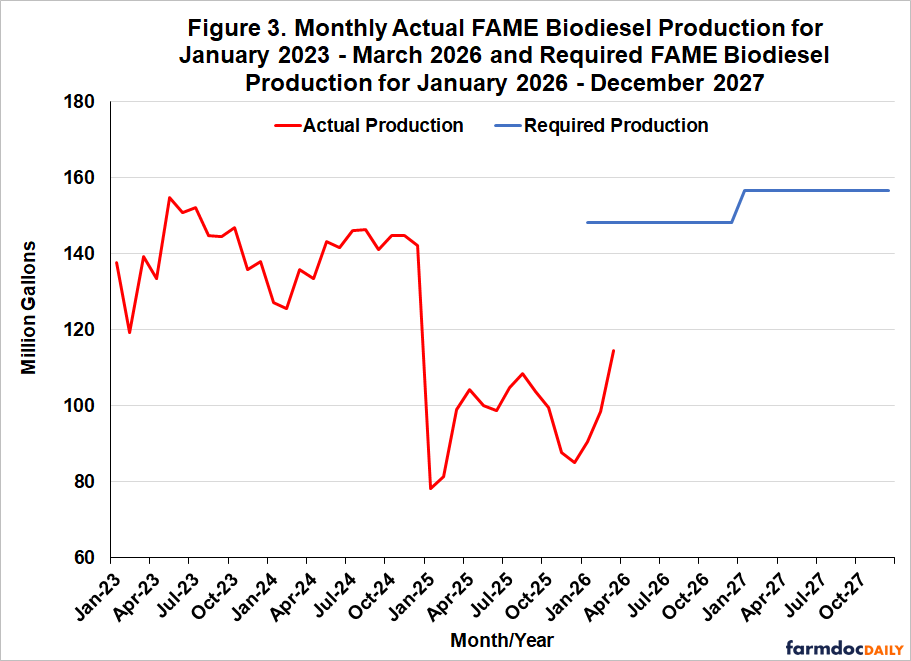
Figure 4 makes the same comparison for renewable diesel, where the challenge is more severe. The required pace is 360 million gallons per month in 2026 and 380 million in 2027. Actual renewable diesel production has never reached either level in a single month: the historical monthly high over 2023–2025 was about 295 million gallons, in June 2024, and production averaged roughly 266 million gallons per month in 2024 and 243 million in 2025. The 2026 requirement thus stands about 22 percent above the highest month ever recorded, and the 2027 requirement about 29 percent above it. Renewable diesel must not merely return to its 2024 pace; it must run well beyond any pace it has previously achieved, every month, for two consecutive years.
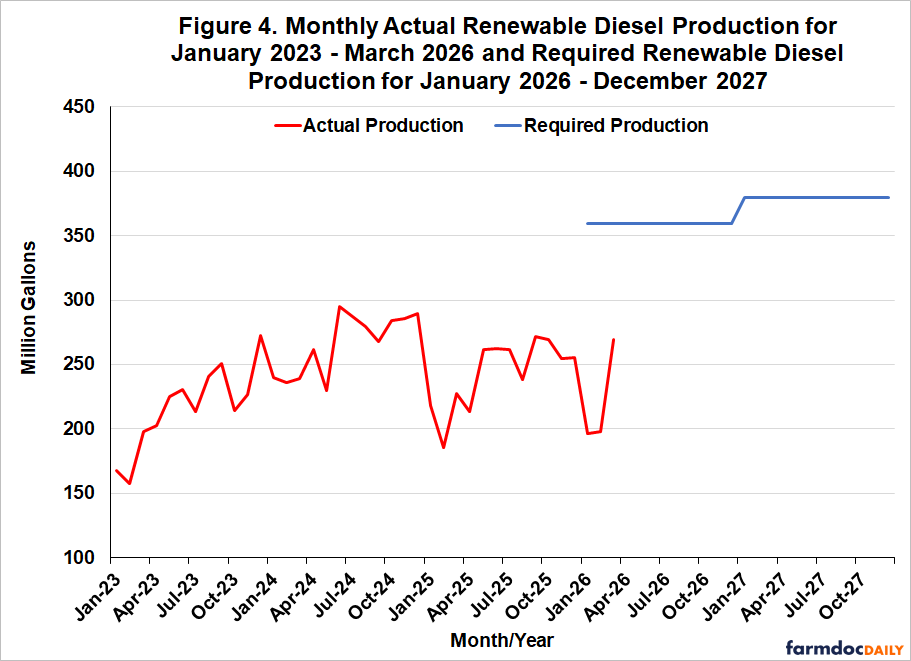
Figure 5 aggregates FAME biodiesel and renewable diesel into total biomass-based diesel production. The required monthly pace is 508 million gallons in 2026 and 536 million in 2027, compared with an all-time monthly high of about 436 million gallons, in June 2024, and averages near 406 million in 2024 and 339 million in 2025. As with renewable diesel, the required pace lies above anything in the historical record—roughly 16 percent above the peak in 2026 and 23 percent above it in 2027—and far above the 287 to 384 million gallon range observed in the first quarter of 2026.
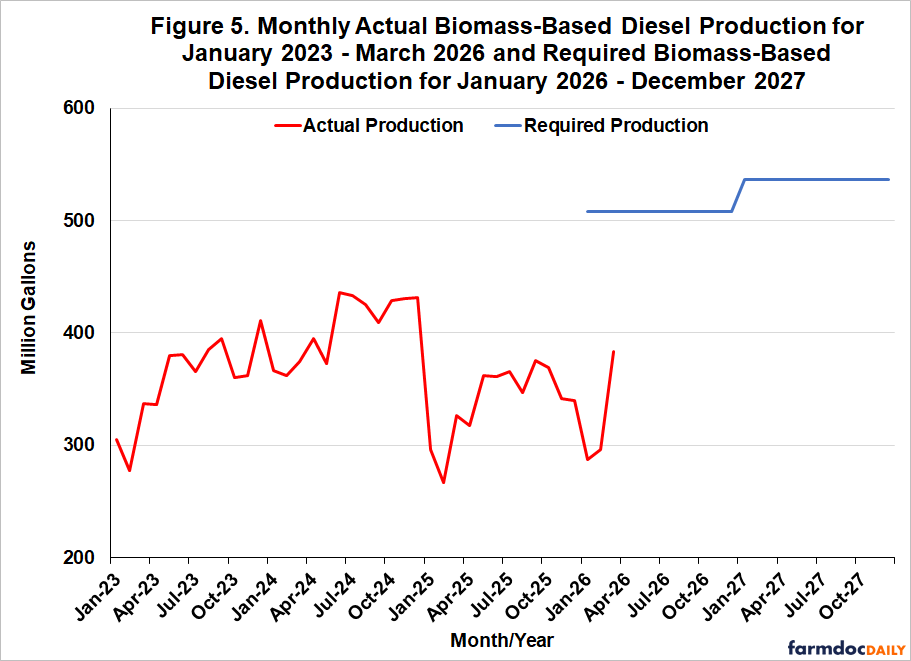
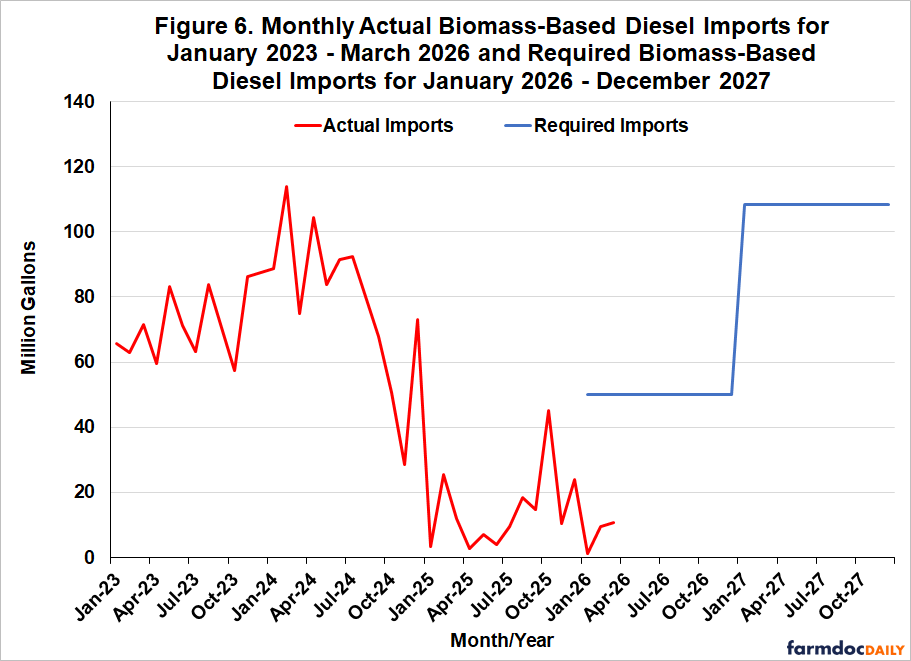
Figure 6 turns to the other margin of adjustment, imports. The required pace of biomass-based diesel imports is 50 million gallons per month in 2026 and 108 million in 2027. These requirements differ from the production requirements in one important respect: they are not without precedent. Imports averaged about 72 million gallons per month in 2023 and 79 million in 2024, so the 2026 import requirement actually sits below the 2023–2024 pace, and the 2027 requirement is only modestly above it. The difficulty is not that the required import volumes are large by historical standards; it is that imports have very nearly stopped. Following the shift from the blenders tax credit to the 45Z credit, for which imported biofuels are not eligible, monthly imports fell to an average of about 15 million gallons in 2025 and to just 1, 10, and 11 million gallons in the first three months of 2026. We implicitly assume in our analysis that D4 RIN prices will rise to the level necessary to incentivize the needed import volumes. However, the challenge is that import volumes have been very small so far in 2026 and it is not yet clear whether recent record D4 RIN prices are high enough to attract sufficient import volumes.
The production and import levels for 2026 and 2027 developed above rest on our projections of required D4 RIN generation, and those projections are subject to several uncertainties. In particular, five factors could result in the required level of D4 generation, and therefore, the required production and imports, differing from our projections. The first is small refinery exemptions (SREs). In our analysis, we followed the EPA in the final Set 2 rulemaking and assumed that 7.55 billion gallons of SREs will be awarded for 2026 and 2027. It is unlikely that fewer than 7.55 billion gallons will be awarded in each year given the criteria used to award SREs, but it is possible that more will be awarded, especially in view of the number of 50 percent SREs awarded in the last round. Because the percentage standards in the final rule are fixed from this point forward, a larger SRE volume will translate into a smaller applicable RVO in volume terms across each fuel category, including biomass-based diesel. However, it would take an exceedingly large increase in the volume of SREs to substantially impact projected D4 RIN requirements. For example, if an additional billion gallons of SREs are awarded in 2025 and 2026, this would only reduce the D4 requirement in 2026 by 279 million gallons, or 23 million gallons per month. EPA decisions on 2025 SREs should be announced in the next few months, and this will provide an important signal on the likely level of SREs through 2027.
The second factor is the level of obligated petroleum gasoline and diesel volumes net of SREs, which provides the base for computing RVOs. In the final Set 2 rulemaking, the EPA projected this base volume to be 180.6 billion gallons for 2026 and 178.8 billion for 2027, and we used the same assumptions in our analysis. The main concern here is that the run-up in crude oil prices associated with the Iran war may reduce gasoline and diesel consumption relative to the EPA’s baseline. Lower obligated volumes would, again, reduce the applicable RVOs in volume terms. The data available so far in 2026 does not indicate a substantial drop off. Nonetheless, this is an uncertainty that should be closely monitoring, as relatively small swings in total obligated gasoline and diesel volume can have notable impacts on mandated volumes.
The third factor is D4 export retirements, which we assumed would be 534 million gallons for 2026 and 2027. This is a cut of 50 percent from 2025, a relatively aggressive assumption. Early 2026 exports of FAME biodiesel and renewable diesel have not dropped by this much, so there is some risk that our projections will be too low. If this is the case, D4 requirements will have to be higher to compensate for the additional export retirements.
The fourth factor is the level of deficits for obligated parties in a compliance year, which is especially hard to anticipate. We assumed that deficits were the same as the last available observation in 2024. It is certainly possible that deficits could be larger in either 2026 or 2027. However, a deficit in a compliance year has to be made up in the following year, meaning that the impact on D4 RIN generation requirements across the two years nets out.
The fifth factor is the level of the RIN bank at the end of a compliance year, which we assumed was 200 million gallons in 2025 and 2026 for combined D4 and D5. This is an extremely low level of carryover RINs and there is not much room for it to be lower. If it is higher, this is a form of additional demand, which would serve to increase D4 RIN requirements. The same logic applies to the ending bank for D6 RINs.
The cumulative effect of these five factors is not easily quantified. Under what we believe are reasonable downside scenarios for SREs, obligated volumes, exports, deficits, and ending banks, our best assessment is that the required pace of required D4 RIN generation would fall to no lower than roughly 850 million RIN gallons per month, compared with the average 954 million RIN gallon pace for 2026–2027 under our baseline assumptions. A pace of 850 million RIN gallons would still exceed the average observed in any year over 2023–2025 and would require sustained generation well above the 592 million gallon average of 2025. Translated into physical terms, even this more conservative scenario would still require domestic production and imports well above their recent pace. The bottom line is that, even under a relatively aggressive combination of downside assumptions, the challenge facing obligated parties and biomass-based diesel producers is only moderately diminished.
Implications
The purpose of this article is to translate the required pace of D4 RIN generation into physical volumes of domestic production and imports needed to meet the final 2026 and 2027 RVOs under the RFS. The results reveal a demanding outlook on both margins of supply. On the domestic side, meeting the final RVOs requires FAME biodiesel to run essentially at its highest sustained pace on record and renewable diesel to run well beyond any pace it has ever achieved, with the combined sector operating at 90 percent of operable capacity in 2026 and 95 percent in 2027. While these are rates that have been demonstrated over multi-month stretches in the past, they sit far above the roughly 60 percent utilization observed as recently as 2025. On the import side, the required volumes are comparable to the standards of 2023 and 2024, but they call for a rebound in a flow that has collapsed under the 45Z credit, for which imported biofuels are not eligible.
These two margins are not independent. The more imports are discouraged by policy, the more of the burden falls on domestic production, and the higher the implied capacity utilization must climb. Our assumption of 600 million gallons of imports in 2026 already presumes a meaningful recovery from the near-zero pace of early 2026; if imports fail to materialize, domestic plants would have to run above the 90 percent rate assumed here—pushing utilization toward, and in some months past, nameplate capacity—or the D4/D5 RIN bank would be drawn down and compliance deficits would accumulate. As shown in our previous article, the D4/D5 bank is essentially exhausted after 2026, which leaves little room for that third margin of adjustment in 2027.
Standing behind every physical gallon of biomass-based diesel is a corresponding requirement for feedstock—soybean oil, distillers corn oil, animal fats, used cooking oil, and imported feedstocks. Production at the levels described here would require feedstock volumes well above recent use, with substantial implications for the soybean oil market and the broader fats and oils complex (Bukowski and Swearingen, 2026). We take up the feedstock implications of the production and import projections in the next article in this series.
The bottom line is that the final Set 2 RVOs ask the domestic biomass-based diesel industry to operate at the upper edge of its demonstrated capability while simultaneously relying on a recovery in imports that current and proposed policy work against. Whether the market can deliver on both fronts at once is a central question for 2026 and 2027.
References
Bukowski, M., and B. Swearingen. “Special Article: Vegetable Oils and Fats Use for Biofuels Production is Forecast to Expand under Current U.S. Biofuels Policies.” Oil Crops Outlook, U.S. Department of Agriculture, Economic Research Service, Situation and Outlook Report, May 2026. https://ers.usda.gov/media/20879/ocs-26e.pdf?v=68086
Gerveni, M., T. Hubbs, and S. Irwin. “Biodiesel and Renewable Diesel: What’s the Difference?” farmdoc daily (13):22, Department of Agricultural and Consumer Economics, University of Illinois at Urbana-Champaign, February 8, 2023.
Hubbs, T., and S. Irwin. “Rewriting the RFS Playbook: Final 2026–2027 RVOs for Biomass-based Diesel.” farmdoc daily (16):66, Department of Agricultural and Consumer Economics, University of Illinois at Urbana-Champaign, April 16, 2026.
Hubbs, T., and S. Irwin. “Rewriting the RFS Playbook: The Impact of Final RVOs on Projected D4 Biomass-Based Diesel RIN Generation for 2026-2027.” farmdoc daily (16):73, Department of Agricultural and Consumer Economics, University of Illinois at Urbana-Champaign, April 27, 2026.
Hubbs, T., and S. Irwin. “Rewriting the RFS Playbook: The Challenge of Meeting D4 Biomass-Based Diesel RIN Generation for 2026-2027.” farmdoc daily (16):82, Department of Agricultural and Consumer Economics, University of Illinois at Urbana-Champaign, May 11, 2026.
Disclaimer: We request all readers, electronic media and others follow our citation guidelines when re-posting articles from farmdoc daily. Guidelines are available here. The farmdoc daily website falls under University of Illinois copyright and intellectual property rights. For a detailed statement, please see the University of Illinois Copyright Information and Policies here.