








Farmland Prices and Government Programs
Farmland prices in Illinois increased dramatically between 2020 and 2023. Since 2023, farmland prices have remained stable or declined slightly. At the same time, farmer returns have declined dramatically and have become negative on cash-rent farmland in some years. Those negative farmer returns have not prompted significant declines in either cash rents or farmland prices. Both farmland prices and cash rents tend to be sticky and do not decline as much as farmland returns. That stickiness in cash rents, and ultimately in farmland prices, is aided by federal support payments through crop insurance, ad hoc assistance, and Commodity Title programs.
Background
Economists generally regard farmland prices as the present value of expected future returns. Higher expected returns lead to higher farmland prices, while lower expected returns put downward pressure on prices.
Many factors affect expectations for future farmland returns, but two of the largest are cash rents and interest rates.
Cash rents: Cash rent is the payment made by the farmer to the landowner. Higher cash rents mean higher returns to farmland and usually imply higher expectations for future returns. As a result, higher cash rents typically lead to higher farmland prices.
Interest rates: Interest rates represent both the return to alternative investments and the cost of financing farmland. Higher interest rates generally put downward pressure on farmland prices. In this article, interest rates are measured by the 10-year Constant Maturity Treasury (CMT) rate. Lower interest rates would be expected to increase farmland prices.
Farmers’ ability to pay cash rents is affected by returns to farming. From those returns, farmers who do not own the farmland pay for land control, often through cash rent. Higher returns to farming typically lead to higher cash rents.
The following sections discuss:
- Farmland prices.
- Cash rents and interest rates. Trends in Illinois cash rents and 10-year CMT rates are shown. Current farmland prices are near the range suggested by historical relationships among cash rents, interest rates, and farmland prices, with perhaps some downward pressure. That relationship currently holds as long as cash rents do not decline dramatically.
- Farmer returns. Trends in farmer returns are shown. Cash rents increase more quickly when returns rise than they decline when returns fall. Current farmer returns do not support continued increases in cash rents.
- Government programs. Current government programs help farmers avoid or delay downward adjustments in cash rents and farmland prices.
Farmland Prices
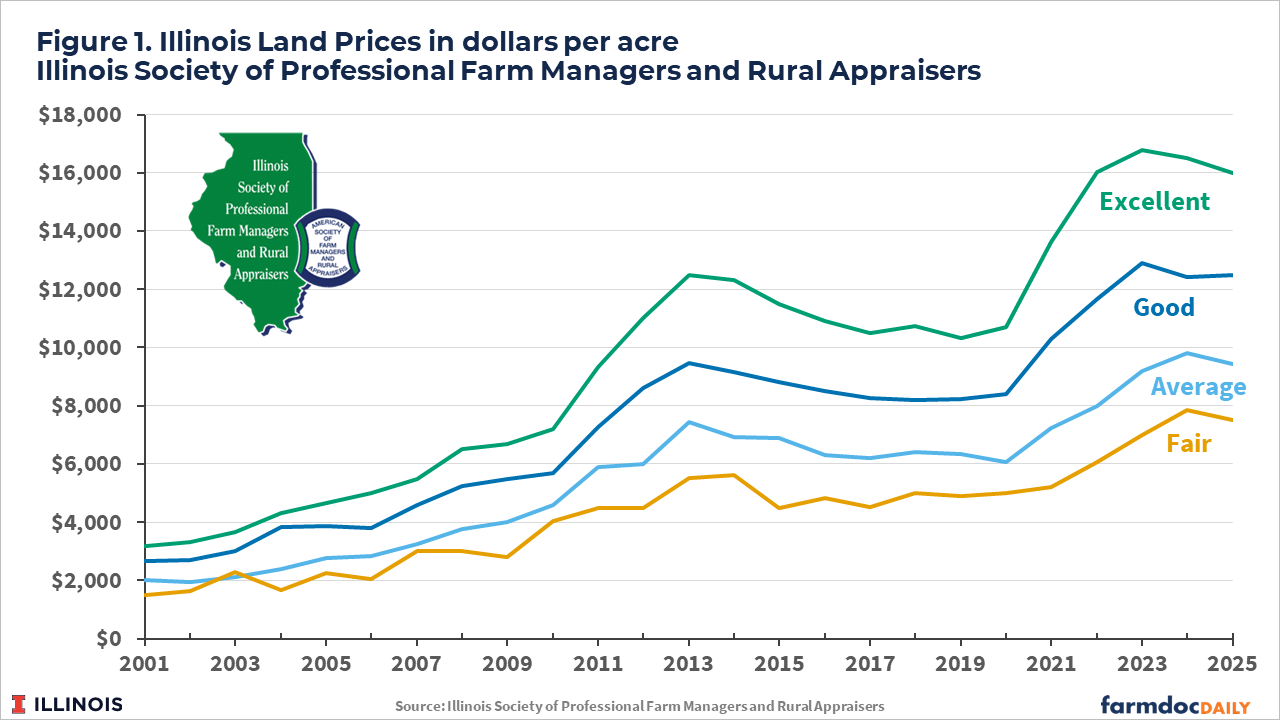
Illinois farmland prices increased dramatically between 2020 and 2023 and have been relatively stable or declined slightly since then. Those trends are evident in the Illinois Farmland Values and Lease Trends report published by the Illinois Society of Professional Farm Managers and Rural Appraisers (ISPFMRA). Excellent-productivity farmland is the highest land class reported by ISPFMRA. It increased from $10,695 per acre in 2020 to $16,779 in 2023, an increase of $6,084 per acre, or 57%. According to ISPFMRA data, excellent-productivity farmland then decreased in both 2024 and 2025, with the 2025 value at $15,984 per acre, a 5% decrease from the 2023 high. Different productivity classes showed similar trends (see Figure 1).
Data for the entire state of Illinois from the National Agricultural Statistics Service (NASS), an agency of the U.S. Department of Agriculture, show similar trends. Farmland prices have increased since 2020, although the NASS series does not show a decline in recent years (see Figure 2). NASS farmland values increased from $7,300 per acre in 2020 to $9,300 per acre in 2023, a 27% increase. Farmland values then increased by 6% from 2023 to $9,850 per acre in 2025.
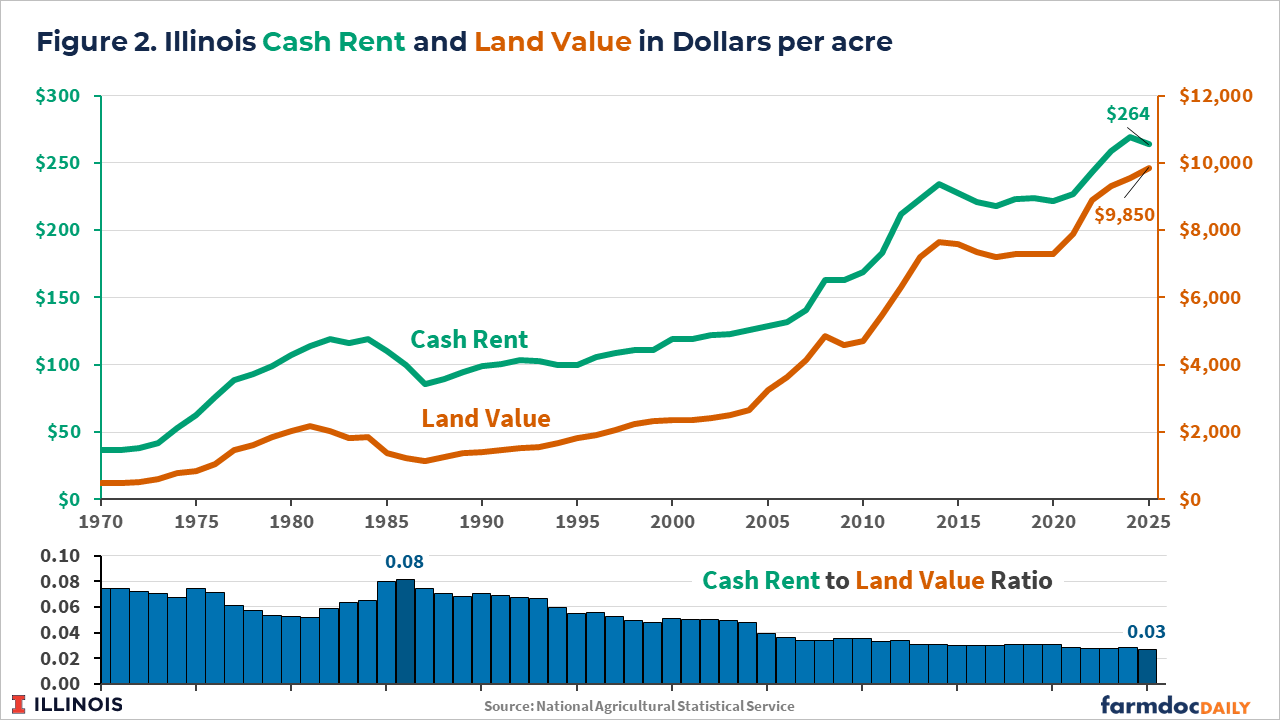
Differences between ISPFMRA and NASS likely reflect differences in the type of farmland being measured. ISPFMRA reports by productivity class, while NASS reports statewide values. Timing also matters. The 2025 ISPFMRA values represent end-of-year values, while NASS releases values near the middle of the year.
Even with those differences, the large increase between 2020 and 2023 is evident from both information sources. Similarly, between 2023 and 2025, farmland values from both NASS and ISPFMRA have been relatively stable and have not lost the gain from 2020 to 2023.
Cash Rents and Interest Rates
Across Illinois, average cash rents increased from $227 to $269 per acre from 2020 to 2024, a 19% increase (see Figure 2). Those increases contributed to the rise in farmland prices. Average cash rents declined slightly in 2025.
At the same time, interest rates have risen. The 10-year Constant Maturity Treasury (CMT) rate increased from 0.89% in 2020 to 4.29% in 2025. In general, higher interest rates put downward pressure on farmland prices.
The combined effects of cash rents and interest rates can be examined by comparing the 10-year Treasury note rate to current farmland returns (see Figure 3). The current return to farmland equals cash rent divided by the value of farmland. A worrisome sign occurs when the 10-year CMT is well above the current return to farmland, as occurred in the 1970s and 1980s. When the 10-year rate is above the current return, much higher current returns are available outside agriculture, and an adjustment is needed. In the 1980s, the adjustment was a decline in land prices (see farmdoc daily, November 26, 2024 and March 23, 2022 for recent analyses).
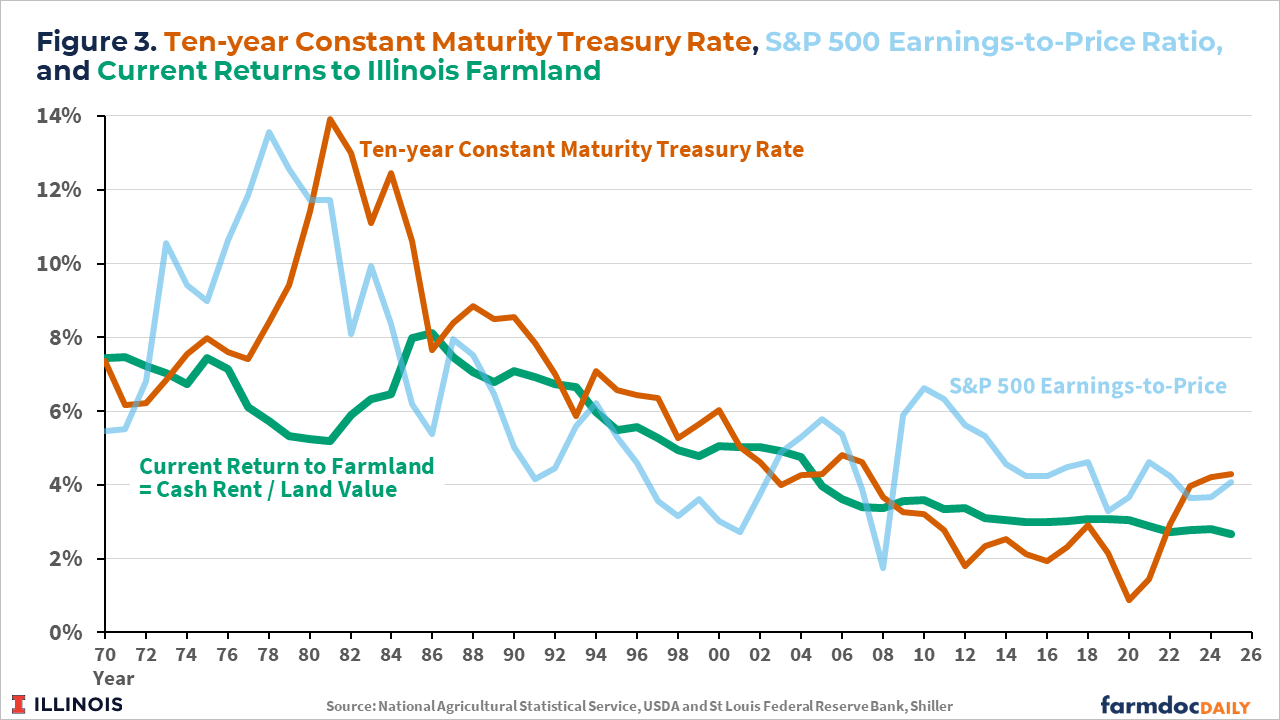
Currently, the 10-year CMT is above the current return. In 2025, the current return to Illinois farmland was 2.7%, while the 10-year CMT averaged 4.3%. That difference suggests some downward pressure on land prices, but not large declines in farmland prices. The differences in 2024 and 2025 are roughly consistent with those that occurred from 1985 through 2000 (see Figure 3).
Also shown in Figure 3 are earnings divided by stock prices for the S&P 500. Those data come from Professor Robert Shiller’s website and are the inverse of the price-to-earnings ratio. Earnings divided by stock price represents the current return to stocks. Current returns from farmland are not far from those of S&P stocks, as measured by the earnings-to-price ratio. That comparison suggests that farmland returns are not out of line with stock market returns, as they were in the 1970s and 1980s. Many of the same factors affecting current returns from farmland are affecting the general economy. Hence, for better or worse, the general declines in earnings-to-price ratios that are affecting agriculture (see farmdoc daily, March 23, 2022 and January 9, 2026) are also affecting the broader economy.
Overall, historical data do not suggest an increase in farmland prices. If anything, they suggest slight downward pressure, but not a large decline. Much will depend on what happens to both interest rates and cash rents. Persistently higher inflation could keep interest rates elevated. The outlook for cash rents raises additional issues.
Cash Rents and Farmer Returns
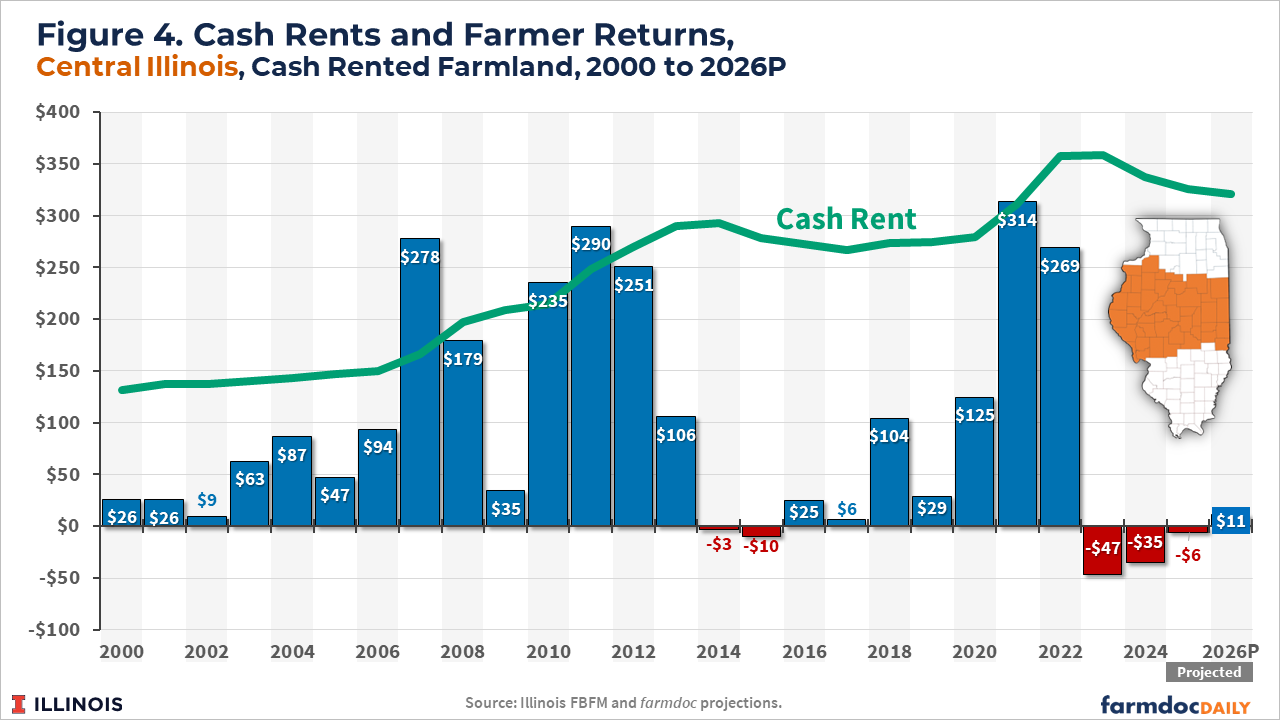
Figure 4 shows cash rents for high-productivity farmland in central Illinois. These rents exhibit the same broad trends as cash rents statewide. Figure 4 also shows farmer returns for cash-rented farmland in central Illinois. These returns include revenue from crop sales, insurance proceeds, and federal government payments. Returns equal revenue minus non-land costs and cash rent (see farmdoc daily, May 19, 2026).
Large increases in cash rents occurred twice in recent decades (see Figure 4). First, cash rents increased from $150 per acre in 2006 to $293 in 2013, an increase of 95%. During much of this increase period, farmer returns were high, largely caused by increasing use of corn in ethanol production. More recently, cash rents increased from $279 in 2020 to $358 in 2022, an increase of 18%. Farmer returns were high in 2021 ($314 per acre) and 2022 ($269 per acre), caused by disruptions in grain supplies due to the Ukraine-Russia conflict.
After both periods of rising cash rents, farmer returns decreased. Farmer returns were -$3 per acre in 2014 and -$10 in 2015. After the 2020-2022 high-return period, returns have been low or negative: -$47 in 2023, -$35 in 2024, -$6 in 2025, and $11 projected in 2026. Cash rents did not decline nearly as much as they had increased during the high-return periods. From 2014 to 2018, cash rents declined from $293 per acre in 2014 to $274, a decline of 6%. From 2023 to 2026, cash rents declined from $369 to $326, a decline of 11%.
Cash rents increase more quickly when economic conditions improve than they decrease when conditions weaken. This pattern reflects the farmland rental market and the desire of many farmers to expand their operations. Landowners do not wish to see cash rents decline, and many farmers are reluctant to lower cash rents because doing so raises the prospect of losing farmland to other farmers. In many cases, a landowner could find another farmer to operate the land. Simply put, many farmers wish to operate more land, resulting in intense pressure in the cash rental market.
This dynamic can lead farmers to forgo income during low-return periods in order to keep rented acreage. Farmers may subsidize higher-rent farmland with owned land or rented land with lower costs. Financial reserves accumulated during higher-return periods, such as those from 2020 to 2022, can also be used to cover rental rates. As a result, cash rents are not likely to fall materially until economic conditions force the adjustment, such as when farmers run out of liquidity or face tighter credit constraints.
Government Programs
Federal government programs likely increase the stickiness of cash rents. These programs mitigate risk or provide payments, allowing farmers to accept additional risk and reducing the pressure to cut cash rents and other costs. Programs include:
Crop insurance: Well over 90% of acres in Illinois are insured, with relatively high coverage levels of revenue insurance. Those insurance policies have been prominent since the 1990s and have helped limit potential losses. Farmers can withstand loss periods without being as concerned about excessively large losses. For a given liquidity and solvency position, a farmer may be willing to take on more risk by not lowering cash rents.
Commodity Title programs: Price Loss Coverage (PLC) and Agricultural Risk Coverage (ARC) provide relief to farmers. These programs support income and returns, which translates to support for farmland rents and prices.
Ad hoc payments: Ad hoc economic assistance has been significant in recent years, including programs such as the Market Facilitation Program (MFP), Coronavirus Food Assistance Program (CFAP), Emergency Commodity Assistance Program (ECAP), and Farmer Bridge Assistance (FBA) (see farmdoc daily, June 23, 2026). These programs provide financial relief to farmers by shoring up working capital and financial positions. They also reduce the need for downward adjustments in cash rents and other costs. Landowners are aware of these programs and likely are less willing to reduce cash rents. The frequency of these programs may lead both farmers and landowners to expect similar assistance in the future.
Moreover, the One Big Beautiful Bill Act, passed last year, significantly increased farmer support. The Act increased support from PLC and ARC programs under the Commodity Title. It also increased premium support for crop insurance, likely resulting in more farmers taking supplemental insurance coverage, which could become an important source of federal support. The prospect of larger future government payments likely reduces the need to cut cash rents now.
Concluding Comments
Cash rents would likely be sticky even without government programs. However, ongoing federal support through crop insurance, ad hoc assistance, and commodity programs reduces the need for farmers to lower cash rents and other costs. In the past decade, frequent ad hoc programs likely have affected stickiness. Moreover, increased support under the One Big Beautiful Bill Act will likely further enhance that stickiness.
Those effects should be considered in program design, with attention to how programs affect cash rents and other cost adjustments. Unfortunately, a dilemma currently exists. On the one hand, abruptly eliminating or making large reductions in support could cause painful declines in cash rents and farmland prices. On the other hand, large ongoing support slows, or even stops, adjustments to the cost structure of crop production that are likely needed for long-term competitiveness and efficiency.
References
Paulson, N., G. Schnitkey and C. Zulauf. "Outlook for Farmland Values in 2025." farmdoc daily (14):215, Department of Agricultural and Consumer Economics, University of Illinois at Urbana-Champaign, November 26, 2024.
Paulson, N., G. Schnitkey, C. Zulauf and B. Zwilling. "Spring Revision to 2026 Illinois Crop Budgets." farmdoc daily (16):88, Department of Agricultural and Consumer Economics, University of Illinois at Urbana-Champaign, May 19, 2026.
Schnitkey, G., N. Paulson, C. Zulauf and J. Baltz. "Inflation and Agricultural Interest Rates." farmdoc daily (13):56, Department of Agricultural and Consumer Economics, University of Illinois at Urbana-Champaign, March 28, 2023.
Schnitkey, G., N. Paulson, C. Zulauf and H. Monaco. "Farmer Support for Crop Farmers from Federal Programs: 2015 – 2024." farmdoc daily (16):109, Department of Agricultural and Consumer Economics, University of Illinois at Urbana-Champaign, June 23, 2026.
Zulauf, C. and B. Sherrick. "The Dramatic Change in US Ag Land Price-Rent Ratio." farmdoc daily (16):5, Department of Agricultural and Consumer Economics, University of Illinois at Urbana-Champaign, January 9, 2026.
Zulauf, C., G. Schnitkey, K. Swanson and N. Paulson. "Land Price-to-Rent Ratio and Interest Rates." farmdoc daily (12):38, Department of Agricultural and Consumer Economics, University of Illinois at Urbana-Champaign, March 23, 2022.
Disclaimer: We request all readers, electronic media and others follow our citation guidelines when re-posting articles from farmdoc daily. Guidelines are available here. The farmdoc daily website falls under University of Illinois copyright and intellectual property rights. For a detailed statement, please see the University of Illinois Copyright Information and Policies here.