








The Clean Fuel Production Tax Credit (45Z), Part 3: Reviewing the Potential Value
Continuing the review of the Clean Fuel Production Tax Credit, this article explores the potential economic benefit that could be created for Midwest corn and soybean producers implementing approved practices. Previously, we introduced the 45Z tax credit and its relevance to grain producers even though the tax credit is claimed by biofuel producers (farmdoc daily, May 27, 2026). We also explained how feedstock carbon intensity scores are calculated for a farm, reviewed the CI-reducing practices recognized under the current FD-CIC framework, and used Illinois corn as a case study to show that the estimated CI benefit from the same practice can differ across counties (farmdoc daily, June 18, 2026). Note: USDA released the official FD-CIC version 1.0 on June 25 and some of the discussion in the second article is now outdated. We discuss the official USDA FD-CIC (USDA, FD-CIC) in more detail, highlighting the main changes relative to the earlier version, in a future article. For the discussion in this article, all calculations are based on the newly released official model.
In summary, whether the potential financial value that could be credited by a recognized CI-reducing practice is large enough to matter for producers depends first on the total tax credit value that could be created under different scenarios. From that total value, the next question is how much of that value might actually be passed on to the farmer–a question that cannot be answered at this time. Importantly, this discussion is intended to inform interested producers about 45Z opportunities, it is not a projection or estimation of actual benefits to the farmer.
Calculating the Total 45Z Value Created per Acre
How much of the 45Z value might be divided between a farmer and a biofuel producer depends first on the total potential tax credit value in the best-case scenario. Farmers do not claim the tax credit directly and in no case could they receive more than the total value created. The total value acts as a useful screening tool because if the total value possible for a recognized conservation practice is too small to matter for a farmer, there is little reason to spend much time thinking about how that value might later be divided.
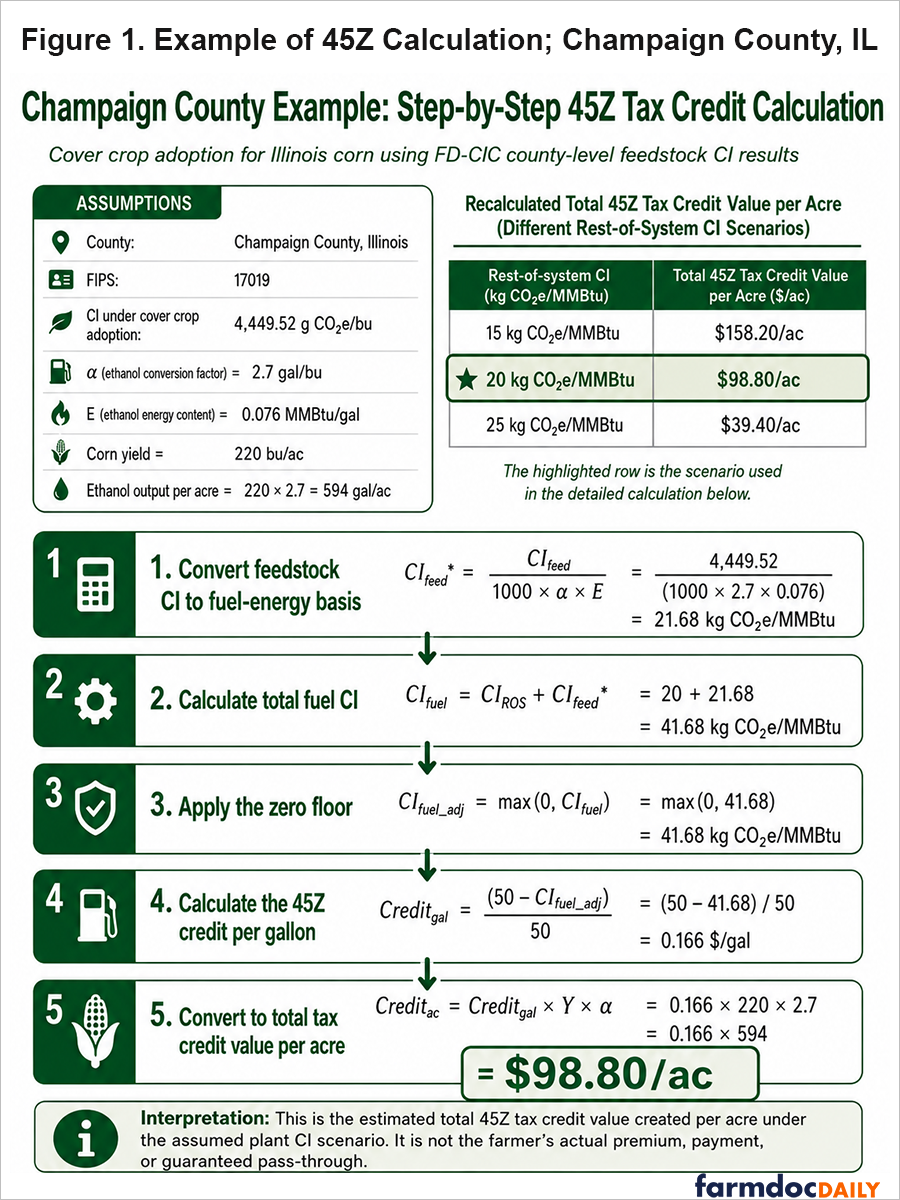
Figure 1 illustrates the step-by-step calculation of the estimated total 45Z tax credit value created per acre for corn produced in Champaign County, Illinois, under a cover crop adoption scenario. The calculation begins with the county-level feedstock carbon intensity under cover crop adoption, estimated at 4,449.52 g CO₂e/bu by FD-CIC, and converts it to a fuel-energy basis using an ethanol conversion factor of 2.7 gal/bu and an ethanol energy content of 0.076 MMBtu/gal. This results in a feedstock CI of 21.68 kg CO₂e/MMBtu. This unit conversion is necessary to align the CI units reported in FD-CIC with those used to calculate tax credits under the 45Z regulation. Adding the feedstock CI to the rest-of-system CI assumption of 20 kg CO₂e/MMBtu, which is a critical assumption explored in the next simulation exercise, yields a total fuel CI of 41.68 kg CO₂e/MMBtu. Applying the 45Z credit formula, this corresponds to a credit rate of $0.166 per gallon. Using a corn yield of 220 bu/ac, approximately 594 gallons of ethanol can be produced if every bushel harvested from this acre is used for biofuel production. Multiplying this by the credit rate per gallon gives an estimated total tax credit value of $98.80 per acre. The comparison table also shows how the estimated value changes under alternative rest-of-system CI assumptions: $158.20/ac if rest-of-system CI decreases to 15 kg CO₂e/MMBtu and $39.40/ac if rest-of-system CI increases to 25 kg CO₂e/MMBtu. Importantly, these values represent the total potential 45Z tax credit value created by the lower-CI feedstock and ethanol production pathway, not the farmer’s guaranteed pass-through from the biofuel producer and out of that total potential value.
Under the current FD-CIC structure, the farm-side feedstock carbon intensity is defined and predetermined by the model. The business-as-usual feedstock CI is fixed at the GREET default, while recognized conservation practices generate a fixed amount of CI reduction for each practice in each county. As a result, the largest remaining uncertainty in calculating the total 45Z tax credit value is the biofuel plant’s rest-of-system CI. Therefore, in this Illinois corn case study, we vary the rest-of-system CI across three different levels (high, medium, and low) and then calculate the resulting total 45Z value created when cover crops are adopted. Cover crop adoption is used as the main illustration because it is already widely discussed by producers and provides a clear visual comparison across counties.
Figure 2 illustrates the total 45Z tax credit value created across Illinois counties. Using county-level FD-CIC corn feedstock CI estimates under cover crop adoption, the feedstock CI is first converted from g CO₂e/bu to kg CO₂e/MMBtu and then combined with assumed rest-of-system CI values of 15, 20, and 25 kg CO₂e/MMBtu. The resulting fuel CI is used to calculate the 45Z credit rate per gallon, which is then converted to dollars per acre using the same corn yield of 220 bu/ac as above, and an ethanol conversion factor of 2.7 gal/bu. The results show that the total credit value is highly sensitive to the rest-of-system CI assumption. Under the low plant-CI case, the estimated total value created ranges from about $107 to $243 per acre across Illinois counties. Under the medium case, the range falls to about $48 to $184 per acre, and under the high plant-CI case, the range declines further to about $0 to $125 per acre. This pattern highlights that because the feedstock-side CI effect from cover crops is fixed by county in FD-CIC, the overall 45Z value created depends heavily on the biofuel producer’s rest-of-system CI.
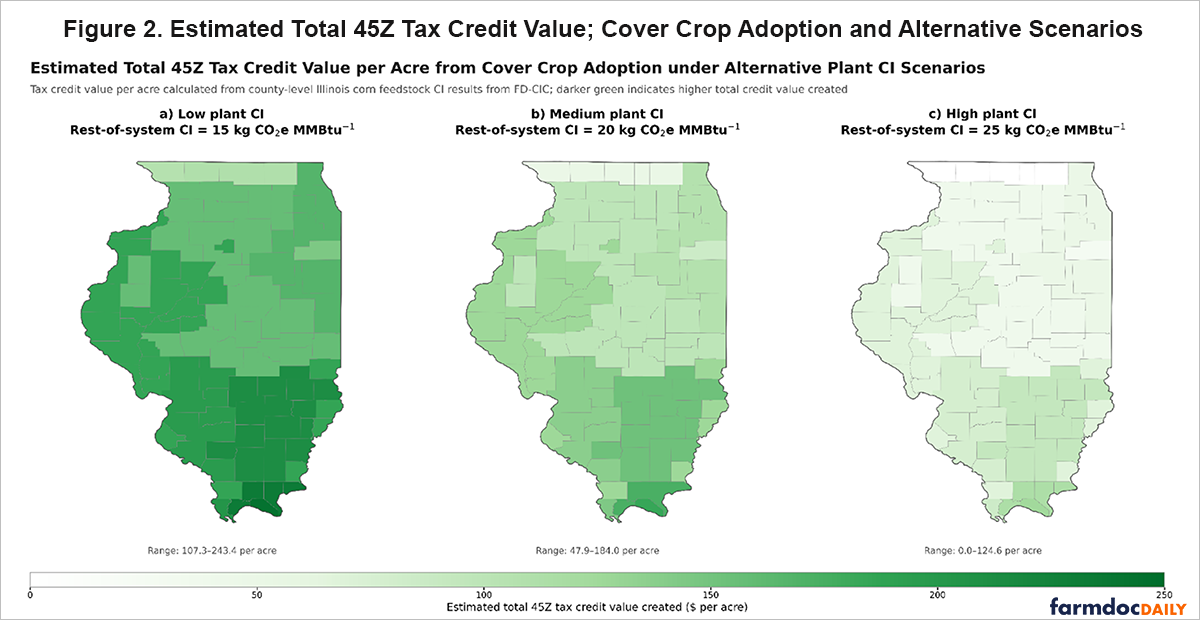
It is worth noting again that Figure 2 does not predict what a farmer will actually receive. Instead, it shows the maximum pool of value created before any grain buyer retention, verification costs, or other market frictions are applied. Producers should therefore only use the figure as a first screening tool. If the total value created appears too small to matter, there may be little reason to spend much more time pursuing the opportunity. If the value appears meaningful, the next step is to watch whether the market develops in a way that allows at least part of that value to reach the farm.
Preparing for a Possible 45Z Market Opportunity
If the county-level estimates of total value created in Figure 2 are large enough to consider implementing the practices, the next step to evaluate is what the farmer needs to do to be prepared for this potential opportunity. This also applies to producers who have already adopted recognized practices for agronomic reasons and want to preserve the option of benefiting from a potential price premium if a 45Z-driven market for low-CI grain emerges.
Even before a fully developed market exists, there are several low-risk steps producers can take, starting with documentation readiness. Producers should pay close attention to how final regulations define recognized practices and what supporting records may be required to demonstrate that those practices were actually adopted. This may include maintaining clear field-level records on conservation practices, dates of field operations, and any supporting materials that could help verify practice adoption. The goal is not to anticipate every detail of official paperwork requirements, because they are not yet final, but to maintain flexibility. Better records create a first-mover advantage. If local grain buyers begin requesting documented evidence of recognized practices, producers with organized records will be in a much stronger position to respond quickly.
Here again, it is important to keep in mind that the total tax credit value will not fully pass through to the farmer. To access the credit, producers must partner with a biofuel plant, meaning the total value created will be shared between producers and the biofuel plant. A county may show a meaningful amount of total value under the scenario analysis, but that does not automatically translate into a higher price for producers. For that to happen, there must be a biofuel plant or grain buyer actively participating in the emerging 45Z-driven market for low-CI grain and willing to offer terms that share part of that value with producers. In that sense, another practical step producers can take is to pay attention to whether local buyers are beginning to show interest in sourcing low-CI grain. It is worth emphasizing again: for producers, 45Z should be viewed first as a potential marketing opportunity, not as a guaranteed source of additional farm revenue.
Concluding Thoughts
For Midwest producers, 45Z creates a possible new market for low-CI grain. Whether it matters for producers depends on three things: how much total tax credit value a recognized practice creates, whether local grain buyers or biofuel plants are willing to source low-CI grain, and how much of that value they are willing to share with producers. In some counties and under some plant-CI assumptions, the total value created may be large enough to attract interest. In other cases, the size of the opportunity may be too small to matter.
The 45Z tax credit should be treated as a market opportunity to watch, not as a guaranteed new source of farm income. Producers who see meaningful potential value in their county can prepare by keeping good records, following how recognized practices and documentation requirements are finalized, and watching whether local buyers begin to offer programs for low-CI grain. Producers who do not see enough value to matter can reasonably set the issue aside for now and revisit it later if the rules or markets change.
References
Coppess, J., and Z. Chen. “The Clean Fuel Production Tax Credit (45Z); Introductory Discussion.” farmdoc daily (16):92, Department of Agricultural and Consumer Economics, University of Illinois at Urbana-Champaign, May 27, 2026. https://farmdocdaily.illinois.edu/2026/05/the-clean-fuel-production-tax-credit-45z-introductory-discussion.html.
Chen, Z. and J. Coppess. "The Clean Fuel Production Tax Credit (45Z), Part 2: Carbon Intensity." farmdoc daily (16):107, Department of Agricultural and Consumer Economics, University of Illinois at Urbana-Champaign, June 18, 2026. https://farmdocdaily.illinois.edu/2026/06/the-clean-fuel-production-tax-credit-45z-part-2-carbon-intensity.html
U.S. Department of Agriculture. USDA Feedstock Carbon Intensity Calculator. USDA website. https://www.usda.gov/usda-fdcic
Disclaimer: We request all readers, electronic media and others follow our citation guidelines when re-posting articles from farmdoc daily. Guidelines are available here. The farmdoc daily website falls under University of Illinois copyright and intellectual property rights. For a detailed statement, please see the University of Illinois Copyright Information and Policies here.