








Sulfur and Increasing Phosphate Fertilizer Prices
Fertilizer price increases associated with the conflict in Iran seem likely to result in higher fertility costs for farmers for the 2027 crop year. Much attention has been given to higher nitrogen fertilizer prices. Prices for phosphate fertilizers, such as Diammonium Phosphate (DAP), have also been increasing. Today’s article links the increases in phosphate fertilizer prices to the significant increase in the price of sulfur, a primary input to the production of phosphate fertilizer products.
Phosphate Fertilizers
DAP and monoammonium phosphate (MAP) are two of the most common fertilizer products used by farmers to provide phosphorous nutrient to their crops. DAP contains 18% nitrogen and 46% phosphorous. MAP’s typical nutrient content is 11% nitrogen and 52% phosphorous. Thus, both products also contribute to nitrogen needs.
The production of DAP and MAP combines mined phosphate rock with sulfuric acid to produce phosphoric acid. The phosphoric acid is then combined with ammonia to produce a slurry which is then typically dried and granulated into the dry forms of MAP and DAP commonly used by farmers. Relative input requirements to produce DAP are 1.5 to 2 tons of phosphate rock with 0.4 tons of sulfur and 0.2 tons of ammonia. Changes in the prices of these primary inputs will translate to changes in the cost to produce phosphate fertilizers.
The primary source of sulfur is as a byproduct during the production of oil and natural gas, with a smaller portion of global production coming directly, or as a byproduct, from mining. China is the leading global producer of sulfur, accounting for nearly 23% of global supplies (USGS, 2026b). The U.S. is the second largest producer, accounting for close to 10%. Other major producers include Russia (8.9%), Saudi Arabia (8.6%), the United Arab Emirates (7.5%), Canada (6%), and Kazakhstan (5.7%).
The U.S. net import reliance on sulfur and sulfuric acid stood at 14% in 2024 and 2025 (USGS, 2026b), similar to net reliance on phosphate rock imports (see farmdoc daily from July 29, 2025 and USGS, 2026a).
DAP and Sulfur Prices
Figure 1 shows average DAP and anhydrous ammonia prices for the Corn Belt region of the US and Vancouver spot prices for sulfur since January 2024. Sulfur prices increased from less than $100 per ton in 2024 to more than $200 per ton by the spring of 2025. Sulfur prices surpassed $400 per ton at the end of 2025 and have in recent months exceeded $1,000 per ton. The sharp increase since March of 2026 is attributed to logistical disruptions in the Middle East region due to the conflict in Iran. The disruptions are also leading to export restrictions being put in place by major producers, such as China and Russia, to address domestic supply concerns putting further pressure on global supplies and contributing to higher prices and the potential for continued volatility moving forward.
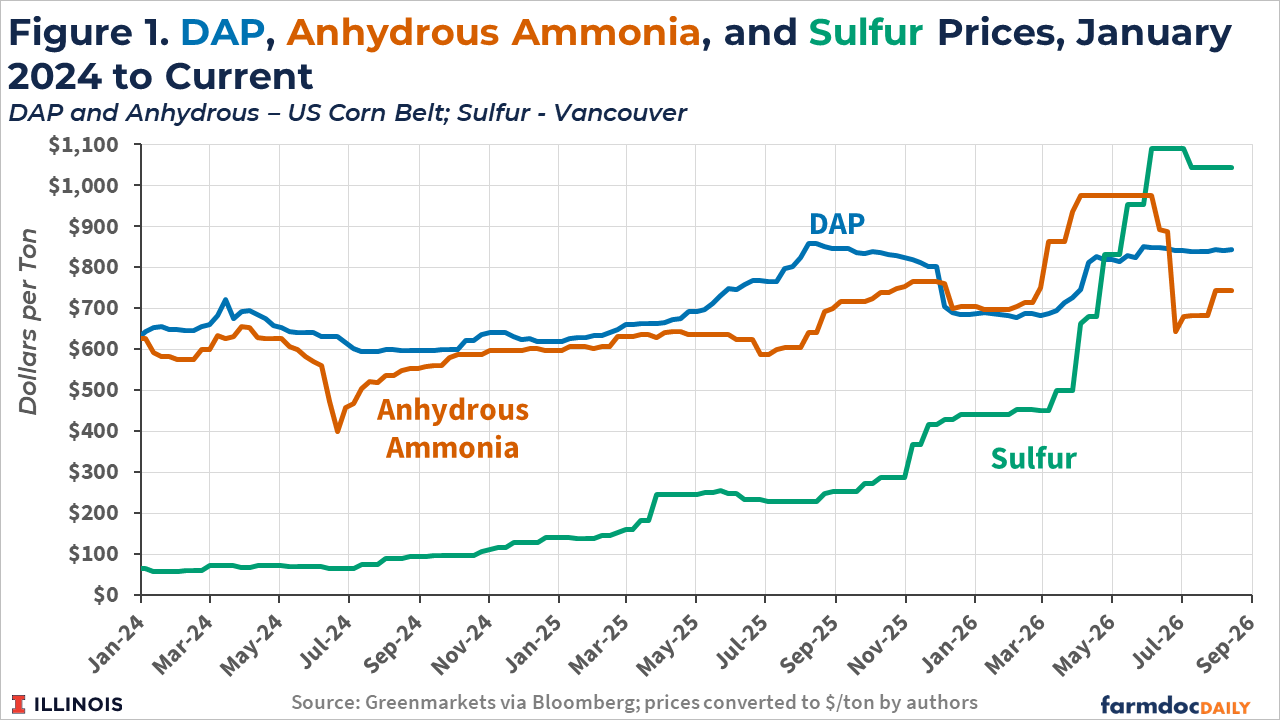
Average anhydrous ammonia prices fell from around $600 per ton during the first half of 2024 to less than $500 per ton in the summer of 2024. Anhydrous prices increased beginning in the summer of 2024, reaching more than $750 per ton by the fall of 2025. In 2026 anhydrous prices rose sharply from around $700 per ton at the start of the year to nearly $1,000 per ton in the few months following the start of the war in Iran. Anhydrous prices have since declined back to around $750 per ton in recent weeks.
Average DAP prices for the US Corn Belt region increased from $600-$700 per ton in 2024 and the first half of 2025 to around $850 per ton in the fall of 2025. Prices have increased from around $700 per ton in the early part of 2026 to current levels of around $850 per ton.
Since 2024, the correlation between the Corn Belt DAP and Vancouver sulfur prices has been positive and statistically strong at 0.70. The correlation between Corn Belt DAP and anhydrous ammonia prices has been similarly strong at 0.65. The impact of significant input price increases are often lagged as firms adjust their pricing, input procurement, and expectations for the future. One concern with how sharply sulfur prices have increased since February is that they will lead to further price increases in products like DAP as the industry continues to adjust, particularly if the price spike persists.
Discussion
As we enter the pricing window for fall fertilizer applications, farmers will be making fertilizer decisions for the 2027 crop which are complicated by high prices and heightened price volatility (see farmdoc daily from August 11, 2026).
Recent sulfur spot prices have exceeded $1,000 per ton, an increase of more than 130% since the beginning of 2026 and more than 300% since August of 2025. This, combined with increases in anhydrous ammonia prices, have put pressure on phosphate fertilizer prices. DAP prices in the Corn Belt region have risen to nearly $850 per ton in recent weeks, up more than 20% than earlier in 2026.
While the U.S. is a major producer of sulfur given our large domestic oil and gas industry, fertilizers and energy products are global commodities, thus exposing U.S. farmers to global supply disruptions and resulting price increases.
References
Monaco, H., G. Schnitkey and N. Paulson. "U.S. Fertilizer Industry in Global Markets: Structure and Supply Risks." farmdoc daily (15):137, Department of Agricultural and Consumer Economics, University of Illinois at Urbana-Champaign, July 29, 2025.
Paulson, N., G. Schnitkey, R. Batts, B. Zwilling and C. Zulauf. "Fertilizer and Fuel Prices Higher Heading into Fall 2026." farmdoc daily (16):143, Department of Agricultural and Consumer Economics, University of Illinois at Urbana-Champaign, August 11, 2026.
USGS. 2026a. Mineral Commodities Summaries – Phosphate Rock. United States Geological Survey. https://pubs.usgs.gov/periodicals/mcs2026/mcs2026-phosphate.pdf
USGS. 2026b. Mineral Commodities Summaries – Sulfur. United States Geological Survey. https://pubs.usgs.gov/periodicals/mcs2026/mcs2026-sulfur.pdf
Disclaimer: We request all readers, electronic media and others follow our citation guidelines when re-posting articles from farmdoc daily. Guidelines are available here. The farmdoc daily website falls under University of Illinois copyright and intellectual property rights. For a detailed statement, please see the University of Illinois Copyright Information and Policies here.