








The US No Loss Crop Sector Safety Net
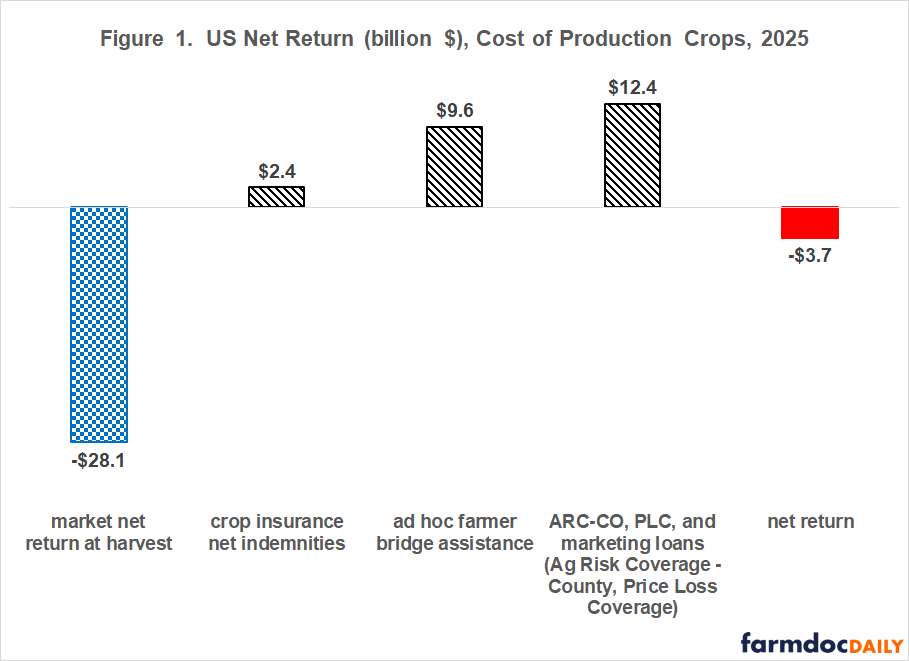
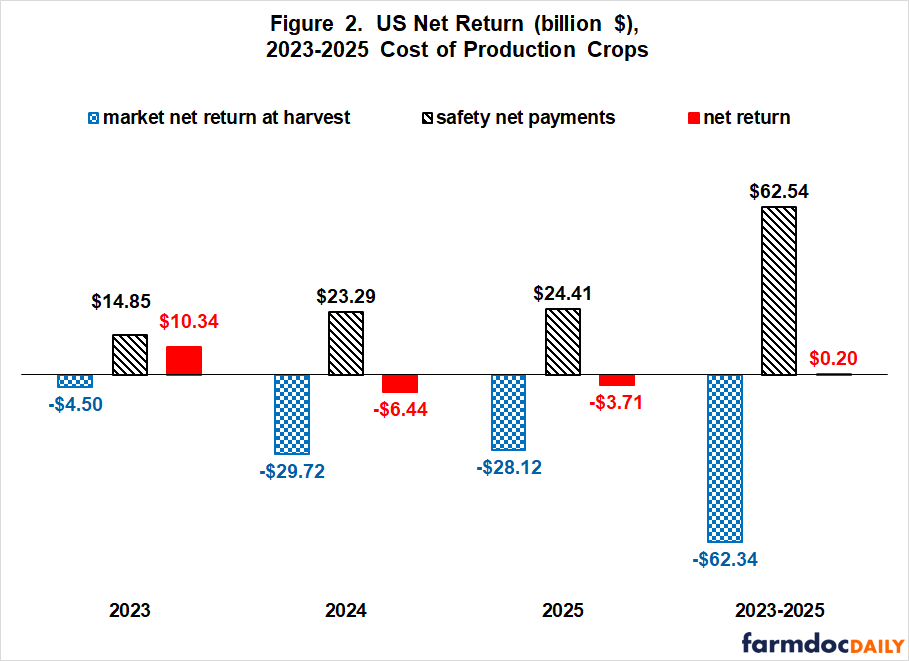
Consistent with “Crop Loss” headlines dating to 2023, combined loss at harvest totaled $28.1 billion for producing the US 2025 cost of production (COP) crops (barley, corn, oats, peanuts, rice, seed cotton, sorghum, soybeans, wheat) (see Figure 1 and Note 1). However, all but $3.7 billion of this loss was covered by the US crop safety net. Moreover, the nine crops collectively broke even over the 2023-2025 crop years as $62.5 billion in safety net payments offset similar market losses at harvest (see Figure 2). This breakeven includes an opportunity cost charge for owned land (i.e. land not rented) and unpaid farm family labor. Eliminating all or almost all sector losses raises stark questions.
Historical Perspective
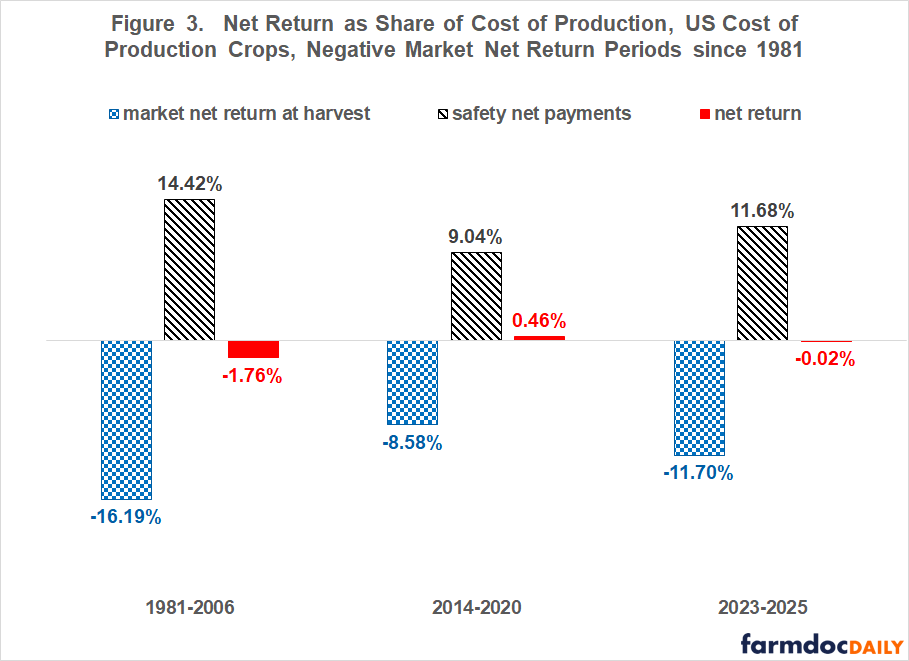
The US crop safety net covered 98% of harvest market losses during the long period of consecutive harvest market losses between 1981 and 2006 (see Figure 3). During the more recent 2014-2020 period of consecutive losses, the safety net covered slightly more than harvest losses. Net return for 2023-2025 falls between these two prior periods of harvest market losses.
Implications
Recent US crop safety net policy has been operated to eliminate field crop sector losses.
It is thus hard to argue that the US field crop sector is in financial distress.
Yes, individual farms are under stress and going bankrupt. But profitability always varies across farms, with some operating at a loss while others earn a profit. Moreover, the variation can be substantial, with some incurring large losses or earning large profits. Thus, if the sector is covering all costs, more than a few farms, maybe even a majority, are making money, and some are likely making lots of money. Farmers making money are usually quiet.
A safety net that eliminates field crop sector losses reinforces the importance of the question raised in the farmdoc daily of February 5, 2026, Has the US crop safety net become excessive?
Sector losses may be distasteful but are important in a market economy.
Without sector losses, inefficiency gains the upper hand, leading to a growing lack of competitiveness. The farmdoc daily of September 25, 2026 is the latest in a large body of articles in farmdoc daily and other outlets, both academic and popular, noting declines in US field crop competitiveness and/or share of world production and trade. Is a loss of international competitiveness what the US wants for its field crop sector?
With the sector breaking even, costs have no reason to decline. The US crop all input price index computed by USDA, NASS (US Department of Agriculture, National Agriculture Statistics Service) was 10% higher in August 2026 than August 2023. It was 1% higher after removing inflation as measured by the consumer price index. Does the US want to protect the crop input sector as well as farmers?
Removing field crop sector losses enhances cropland’s attractiveness as a risk-reducing component of a well-diversified investment portfolio. Unless well-diversified themselves, farmers will find it hard to compete for cropland with nonfarm diversified investment funds. Does the US want an agriculture in which owning cropland requires a well-diversified investment portfolio?
The proceeding questions point to this key policy question: What sector loss is appropriate to facilitate the field crop sector the US wants in its future?
Note 1: Data and Procedures
The US crop safety net is composed of commodity, crop insurance, and ad hoc & emergency programs. Payments by these programs are reported by USDA (US Department of Agriculture), FSA (Farm Service Agency), RMA (Risk Management Agency), and ERS (Economic Research Service), or calculated using data reported by these agencies. Economic cost and net return per acre planted to barley, corn, cotton, oats, peanuts, rice, sorghum, soybeans, and wheat is calculated by ERS. All inputs needed to plant, harvest, and put the crop in storable condition are assigned a cost except management. Unpaid labor and farmer owned land are assigned an opportunity cost. Gross return includes income from a crop’s primarily product, such as grain and cotton lint, and secondary product(s), such as straw and cottonseed. Price of the product is for the crop’s harvest period. Gross return does not include safety net payments and storage returns. Cost does not include crop insurance premium and storage cost. Net return is thus a market return to the economic cost of production per planted acre as of harvest. Net return and economic cost per planted acre for a crop and year are multiplied by acres planted to the crop that year, as reported by USDA NASS, to generate total US net return and US economic cost for the crop in the year. Net return and economic cost for each COP crop for a year are summed to generate collective net return and economic cost for the nine crops and year. For in-depth discussion of the data and calculations used for this article see Zulauf, Langemeier, and Schnitkey (2022) and the two data notes in the farmdoc daily article of February 5, 2026.
References
Colussi, J., M. Langemeier, G. D. Faleiros, L. Brito and A. Neto. "Farmland Values and Competitiveness in the United States and Brazil." farmdoc daily (16):173, Department of Agricultural and Consumer Economics, University of Illinois at Urbana-Champaign, September 25, 2026.
Zulauf, C., D. Orden and G. Schnitkey. "Has the US Crop Safety Net Become Excessive?" farmdoc daily (16):18, Department of Agricultural and Consumer Economics, University of Illinois at Urbana-Champaign, February 5, 2026.
Zulauf, C. M. Langemeier, and G. Schnitkey. 2022. U.S. Crop Profitability and Farm Safety Net Payments since 1975. Journal of the American Society of Farm Managers and Rural Appraisers. Pages 60-69. https://www.asfmra.org/resources/asfmra-journal
Disclaimer: We request all readers, electronic media and others follow our citation guidelines when re-posting articles from farmdoc daily. Guidelines are available here. The farmdoc daily website falls under University of Illinois copyright and intellectual property rights. For a detailed statement, please see the University of Illinois Copyright Information and Policies here.