2018 World Soybean Trade: Aberrations from Recent Trends
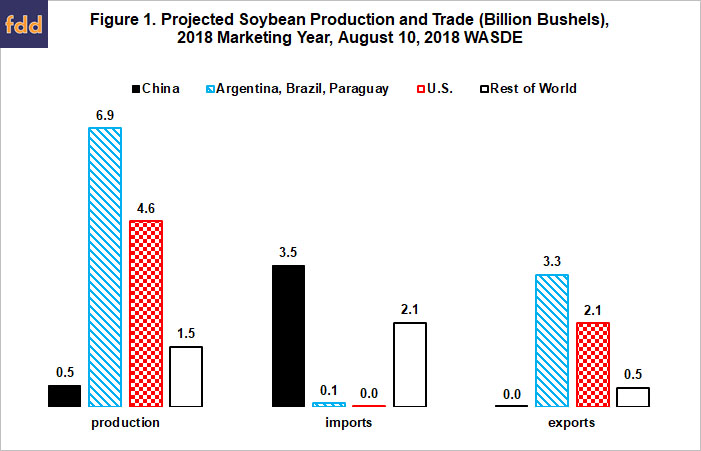
Soybeans are one of the products at the center of President Trump’s use of tariffs to impact trade policy. China has imposed a 25% counter-tariff on US soybeans. It buys 60% to 65% of world soybean imports while the US exports nearly half of its soybean production. This article highlights aberrations in projected 2018 world soybean trade from recent trends.
China’s Imports
The August 2018 World Agricultural Supply and Demand Estimates (WASDE) forecasts China’s soybean imports at 3.5 billion bushels during the upcoming 2018 crop year (see Figure 1 and data note 1). This is 26% of world production that will be harvested in the northern hemisphere, including the US, this fall and in the southern hemisphere, including Argentina and Brazil, next year.

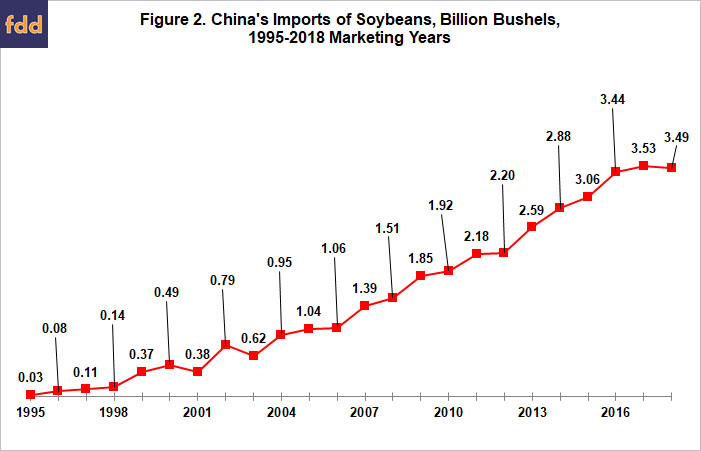
China’s imports are 1% lower for the 2018 than for the 2017 marketing year. Although small, this decline is the first since 2003 (see Figure 2 and data note 2). It is only the 3rd since 1995 when China emerged as a consistent soybean importer.

China’s Imports vs. non-US Exports
Assuming current projections are met, China’s imports for the 2018 marketing year take up 93% of world soybean exports excluding the US, only 250 million bushels less than total non-US world exports. This will be only the 2nd year this decade in which China’s soybean imports take up less than 100% of non-US soybean exports (see Figure 3). The only other year is the high price, US drought year of 2012. Nevertheless, China is expected to import some U.S. soybeans as South American production will not likely become available in large quantities until sometime during February or early March. The need for these bridge imports in part reflects Argentina’s drought-reduced production harvested earlier this year, which is currently forecast to be 661 million bushels lower than for its prior crop.

China’s Imports vs. Imports by Rest-of-World (ROW)
Assuming current projections are met, 2018 will be the first year since China emerged as a consistent importer in which the 5-year average growth rate in soybean imports will be lower for China than for ROW (see Figure 4 and data note 3). After a long slow downtrend due in part to ever larger imports (it is easier to grow faster when a variable is small in size), China’s growth rate had plateaued at 10% until the 2018 projected decline. In contrast, rate of growth in soybean imports by ROW has been increasing since 2011.

Summary Observations
- Assuming current WASDE projections for the 2018 marketing year are met, several aberrations from recent world soybeans trends will occur.
- An important question is, “Are these aberrations largely the result of the tariff conflict or do they signal a strategic pivot point?” Often unusual events become the proximate cause of a pivot point that has been building for some time. The answer is very important for US soybeans in particular and for US agriculture in general.
- A specific pivot point of interest is whether China is being replaced as the marginal growth factor in soybean demand? Whatever the answer, it appears no longer to be sufficient to simply follow China to understand world soybean demand growth.
- If the China trade dispute is not resolved in the next couple of months, a short run market implication is that 2018 U.S. soybean exports to China and probably in total will depend on how early northern Brazil plants, which is largely a function of when their rains start.
Data Notes
- WASDE is published by US Department of Agriculture (USDA), Office of the Chief Economist.
- Data for marketing years prior to 2016 are from USDA, Foreign Agriculture Service.
- For additional discussion of these comparative growth rates see Zulauf.
References and Data Sources
US Department of Agriculture (USDA), Foreign Agriculture Service. “Production, Supply, and Distribution Online.” https://apps.fas.usda.gov/psdonline/
U S Department of Agriculture (USDA), Office of the Chief Economist. August 10, 2018. World Agricultural Supply and Demand Estimates. WASDE-580. http://www.usda.gov/oce/commodity/wasde/index.htm
Zulauf, C. “Soybeans, China, and the Rest of the World: Changing of the Guard?” farmdoc daily (6):202, Department of Agricultural and Consumer Economics, University of Illinois at Urbana-Champaign, October 26, 2016.
Disclaimer: We request all readers, electronic media and others follow our citation guidelines when re-posting articles from farmdoc daily. Guidelines are available here. The farmdoc daily website falls under University of Illinois copyright and intellectual property rights. For a detailed statement, please see the University of Illinois Copyright Information and Policies here.


