


Biodiesel Production Profits and Tax Credits
The biodiesel industry in the U.S. has faced a number of headwinds in the last decade, including the COVID pandemic, competition from surging renewable diesel production, and the entire biomass-based diesel industry going over the “RIN cliff” in the second half of 2023. Several biodiesel plants have been shuttered as a result (Sanicola, 2024). However, all of the news has not been negative. In particular, tax credits at both the state and federal level have been upped in recent years. The purpose of this article is to examine the impact of these tax credits on the profitability of FAME biodiesel production in the U.S.
Analysis
We will use a model of a representative Iowa FAME (fatty acid methyl ester) biodiesel plant to assess production profitability. The model is a modified version of the representative FAME biodiesel plant model developed by Don Hofstrand at Iowa State University, and it has been used in several previous farmdoc daily articles (e.g., February 16, 2022; March 11, 2024). The version of the representative biodiesel plant model used here incorporates several key assumptions:
- 30 million gallons annual biodiesel production capacity.
- Plant construction cost of $1.57 per gallon of nameplate capacity.
- 50 percent debt and 50 percent equity financing.
- 8.25 percent interest on a 10-year loan for debt financing, with the loan paid off in 2017.
- Plant operates at 100 percent of nameplate capacity.
- Plant only processes soybean oil into biodiesel.
- 7.55 pounds of soybean oil feedstock used per gallon of biodiesel.
- 0.9 pounds of glycerin co-product per gallon of biodiesel.
- Seven cubic feet of natural gas per gallon of biodiesel.
- 0.8 pounds of methanol used per gallon of biodiesel.
- Non-soybean oil/non-natural gas variable costs are indexed to the U.S. Consumer Price Index (CPI) for all cities and consumers, which results in this category of costs rising from $0.25 per gallon in 2007 to $0.39 in 2026.
- Total fixed costs of 26 cents per gallon of biodiesel through 2017 and 20 cents per gallon thereafter.
- Marketing fees for biodiesel and glycerin are also indexed to inflation using the CPI. This results in the marketing fee for biodiesel rising from $0.10 per gallon in 2007 to $0.16 in 2026. The glycerin marketing fee is small enough, around a penny, that the adjustment has little impact.
This model is meant to be representative of an “average” plant constructed in 2007 to process soybean oil into biodiesel. There is certainly substantial variation in capacity, production efficiency, and feedstock across the industry and this should be kept in mind when viewing profit estimates from the model.
To track plant profitability over time, we use a Midwest biodiesel price from Fastmarkets (formerly Jacobsens) to represent biodiesel prices at Iowa ethanol plants. The Fastmarkets price is FOB at Upper Midwest biodiesel plants. Eight states are included in the Upper Midwest region by Fastmarkets: Iowa, Illinois, Minnesota, Missouri, Nebraska, North Dakota, South Dakota, and Wisconsin. Nearly half the biodiesel plants found in this eight-state region are located in Iowa. In our earlier work on biodiesel plant profitability (e.g., February 16, 2022) we used plant biodiesel prices from the Agricultural Market Service (AMS) of the USDA. The Fastmarkets and AMS biodiesel prices track each other very closely through 2020. After 2020 there is a clear and unmistakable change in the behavior of AMS biodiesel prices relative to the Fastmarkets prices, with AMS reported prices much lower. This tendency towards lower AMS prices became especially pronounced starting in 2023. For consistency, the Fastmarket biodiesel price is used for the entire sample period over 2007-2026.
Soybean oil prices at Iowa plants are collected from the AMS starting in 2007. Natural gas costs over 2007 through March 2014 are based on monthly industrial prices for Iowa available from the EIA. Due to a change in the behavior of the industrial price series, starting in April 2014, natural gas costs are based on monthly electric power consumer prices for Iowa, also from the EIA. Glycerin and methanol prices are obtained from OPIS.
We include three different tax credits in the revenue for a representative biodiesel plant:
- The Iowa Biodiesel Production Credit is four cents per gallon capped at 25 million gallons per facility (or $1 million per facility). This works out to 3.3 cents per gallon for the 30-million gallon biodiesel plant modeled here. Importantly this is a sales and use tax refund rather than an income tax credit, which means that plant level losses are irrelevant to earning the credit. In addition, this production credit started in 2011, and its value was two or three cents per gallon before 2022.
- The federal Small Agri Producer Credit is currently 20 cents per gallon of biodiesel up to 15 million gallons per year and only for small producers with capacity not exceeding 60 million gallons annually. Since the biodiesel plant modeled here is 30 million gallons, the upper limit on capacity does not apply. With the 15 million gallon eligibility limit (or $3 million per facility), the credit currently works out to 10 cents per gallon for the 30-million gallon biodiesel plant modeled here. Note that this is a general business credit that offsets federal income tax liability. If the biodiesel plant experiences losses in a tax year, the credit can be carried back one year or forward up to 20 years. We do not attempt to match the timing of when this credit is actually earned by the biodiesel plant. Instead, we count the credit in the year the biodiesel plant was eligible for the credit, regardless of whether the plant experienced a loss. In that sense, we treat the Small Agri Producer Credit in accrual terms. Finally, this credit was 10 cents per gallon from January 2007 through June 2025, with the same limits.
- The federal 45Z Clean Fuel Production Credit is also a general business credit that offsets federal income tax liability. It went into effect in 2025 and replaced the $1 per gallon blender tax credit for biodiesel and renewable diesel. The 45Z credit is a sliding scale based on a plant’s carbon intensity (CI) score. See Buffie (2023) for details about the computation of the credit. We use the 45Z-GREET model currently available at the Department of Energy website to compute a CI score for a representative Midwest biodiesel plant that uses soybean oil as a feedstock. The CI score is 33.23 kgCO2e/MMBTU for 2025, but drops to 20.67 in 2026 because indirect land use charges (ILUC) are no longer applicable. Considering the rounding rules for computing the credit and inflation adjustments, these CI scores translate into estimate 45Z credits of $0.32 per gallon in 2025 and $0.66 per gallon in 2026. Note that these are only estimates because final guidance on the 45Z credit has not been issued by the U.S. Department of Treasury. Like the Small Agri Producer Credit, the 45Z credit is a general business credit that offsets federal income tax liability. If the biodiesel plant experiences losses in a tax year, the credit can be carried back three years or forward up to 20 years. Finally, 45Z credits are transferable to other entities, and an active secondary market has developed for entities with excess credits in a tax year. This makes timing considerations for the 45Z credit relative to losses less relevant.
Weekly FAME biodiesel production profit net of all variable and fixed costs is shown in Figure 1. These are pre-tax profits with the exception of the three tax credits discussed above. The sample is divided into two parts to roughly correspond to the pre-renewable diesel boom years of 2007-2020 and the renewable diesel boom years of 2021-2026. Profits after accounting for tax credits averaged $0.05 per gallon during 2007-2020 compared to -$0.10 per gallon in the renewable diesel boom years of 2021-2026. This confirms the difficult profitability conditions that biodiesel plants have, on average, faced since 2021. In particular, there are only limited periods of profitability over 2023-2025. It is also interesting to observe the huge range in profitability in the last five years, from losses of $1.50 per gallon to profits above $1.00 per gallon.
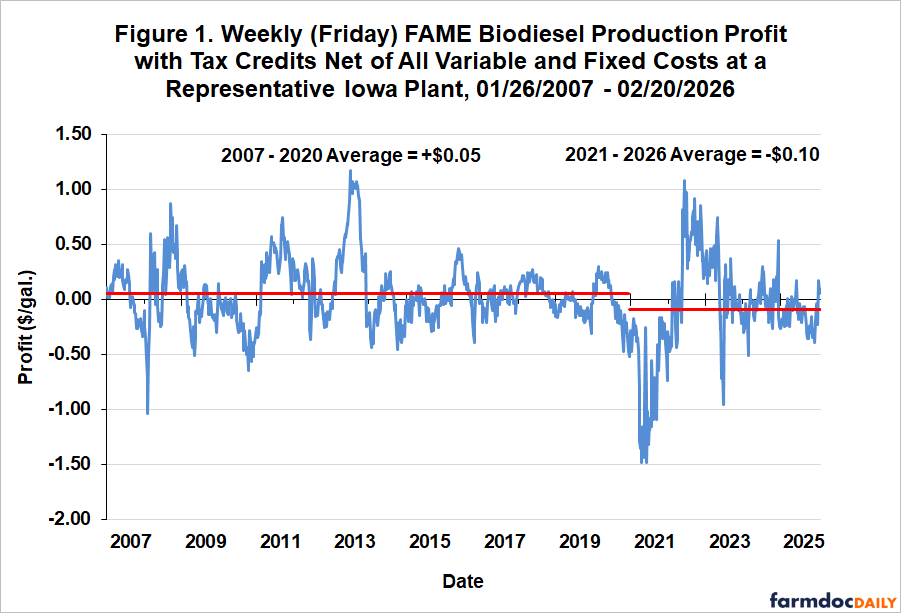
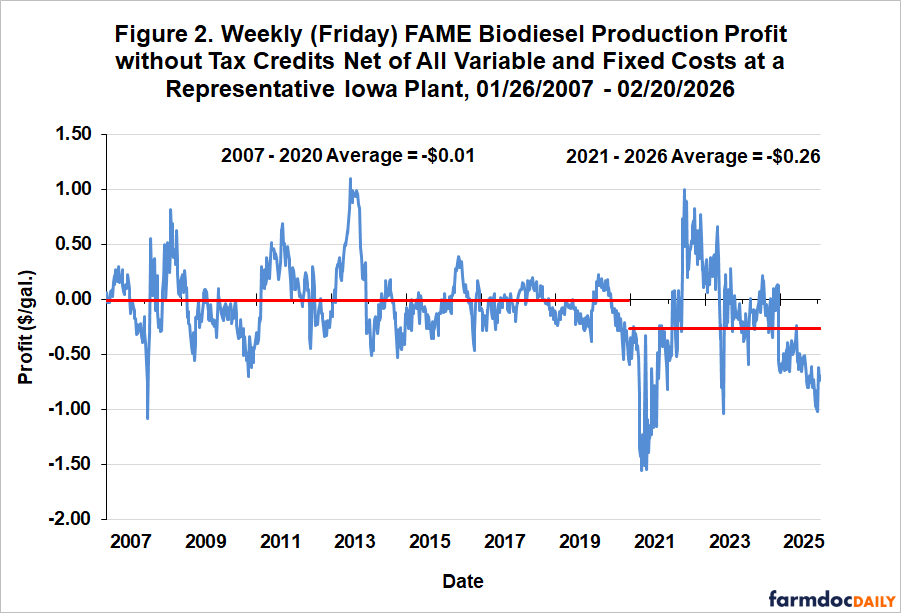
Figure 2 presents the same profits as in Figure 1 except the tax credit revenue is excluded. This only has a modest impact on average profits over 2007-2020, dropping from $0.05 to -$0.01 per gallon. The impact is much larger over 2021-2026, with the average dropping from -$0.10 to -$0.26 per gallon. Without the tax credit revenue, the financial hardships of biodiesel producers would have been dramatically worse. This is especially so in 2025 and 2026 when tax credits totaled $0.45 and $0.79 per gallon, respectively. Previous to 2025, the total for tax credits was much smaller, ranging between five and eight cents per gallon. It is important to point out that the results for 2025 and 2026 without the tax credits are not entirely surprising. The 45Z tax credit is an indirect production subsidy to FAME biodiesel producers that effectively shifts the biodiesel supply curve downwards, which results in a lower biodiesel price all else constant. By design, the 45Z tax credit offsets the lower biodiesel price. Still, this is a general theoretical argument, and it is important to understand how this process plays out in reality.
An alternative way of viewing the financial situation of biodiesel producers is presented in Figure 3, which shows the difference between weekly FAME biodiesel prices at the representative Iowa plant and a computed shutdown price. We define the shutdown price as the biodiesel price plus glycerin revenue plus tax credit revenue minus the variable cost of production. This is based on the classical economic theory of the firm, which predicts that production should cease if price does not cover average variable cost. In the chart, positive blue bars indicate the biodiesel price is above the shutdown price. Likewise, negative red bars indicate the biodiesel price is below the shutdown price. Outside of the COVID pandemic period of 2020-2021, extended periods of biodiesel prices below the shutdown price are relatively infrequent when the impact of tax credit revenue is considered. This trend continued during the renewable diesel boom years, albeit with somewhat more frequent shutdown signals.
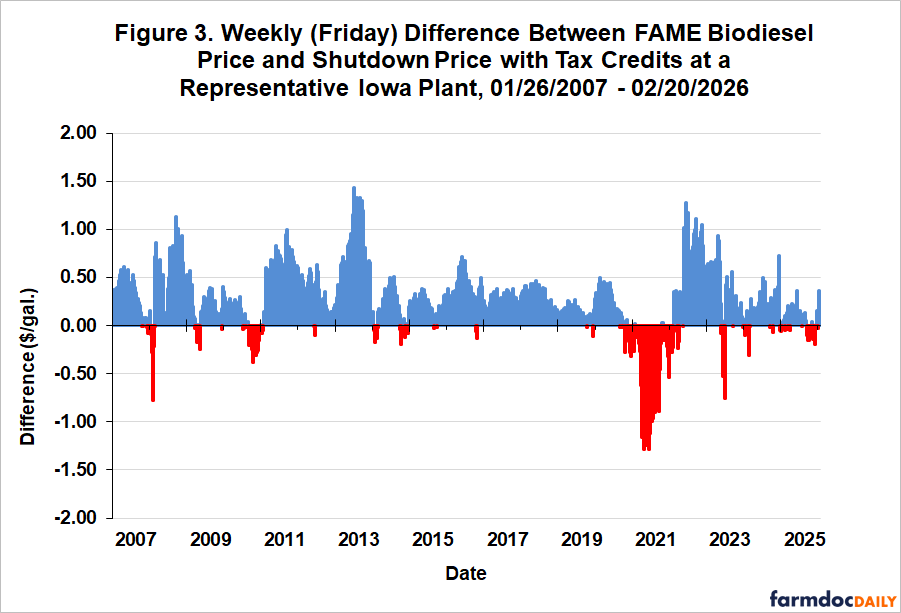
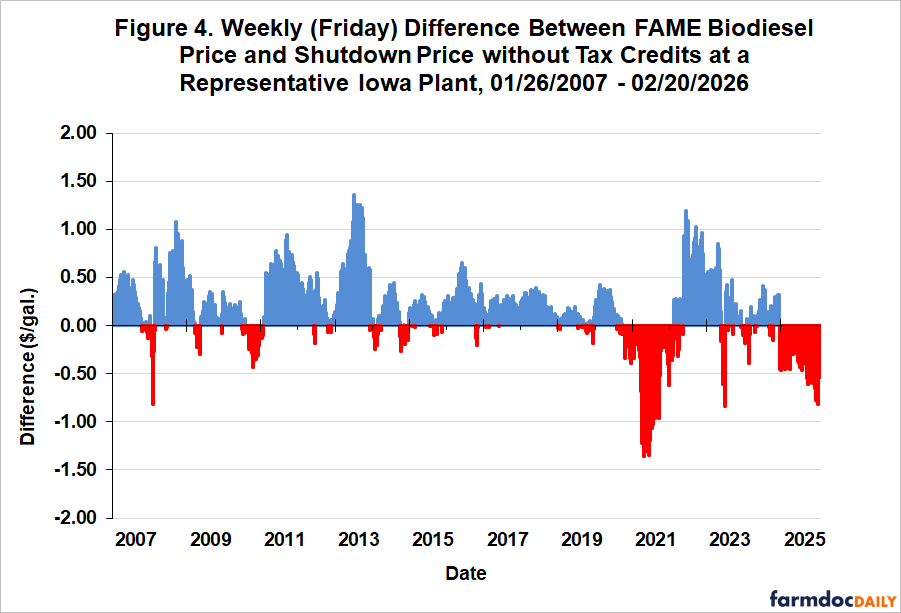
Figure 4 presents the same shutdown analysis as in Figure 3 except the revenue from tax credits is excluded. This only marginally increases the frequency of shutdown signals during the 2007-2020 pre-boom years, which makes sense given the relatively small amount of tax credit revenue during this period. The opposite occurs in the 2021-2026 renewable diesel boom years when there are long periods where shutdown is signaled. Since the beginning of 2025, there has not been a single week where the market signal for biodiesel plants was to keep operating. This is dramatic evidence of the crucial role that tax credits have played recently in preventing widespread shutdowns of biodiesel plants in the U.S.
Implications
The analysis presented in this article paints a stark picture of the financial condition of FAME biodiesel plants in the U.S. Tax credits have been crucial to staving off an even larger wave of plant shutdowns in recent months. Without tax credit revenue, the market would have signaled that biodiesel plants shut down production every single week since the beginning of 2025. This implies that tax credits are important for biodiesel plants remaining operational, with market prices alone not providing enough incentives to keep plants running presently. Looking ahead, this situation raises the stakes even higher for the upcoming EPA final rulemaking on Renewable Volume Obligations (RVOs) for 2026 and 2027. Strong RVO mandates for biomass-based diesel would boost biodiesel prices, provide crucial additional revenue for biodiesel plants, and help restore profitability. Without meaningful RVO increases, it is difficult to be optimistic about the profitability outlook for the U.S. FAME biodiesel industry.
References
Buffie, N.E. “The Section 45Z Clean Fuel Production Credit.” In Focus, Congressional Research Service, September 27, 2023. https://www.congress.gov/crs_external_products/IF/PDF/IF12502/IF12502.2.pdf
Irwin, S. "Biodiesel Prices and Profits…Again." farmdoc daily (14):49, Department of Agricultural and Consumer Economics, University of Illinois at Urbana-Champaign, March 11, 2024.
Irwin, S. "2021 Was a Devastating Year for Biodiesel Production Profits." farmdoc daily (12):21, Department of Agricultural and Consumer Economics, University of Illinois at Urbana-Champaign, February 16, 2022.
Sanicola, L. “Chevron Idles Two US Midwest Biodiesel Plants as Profits Slip,” Reuters, March 1, 2024. https://www.reuters.com/business/energy/chevron-idles-two-us-midwest-biodiesel-plants-profits-slip-2024-03-01/
Disclaimer: We request all readers, electronic media and others follow our citation guidelines when re-posting articles from farmdoc daily. Guidelines are available here. The farmdoc daily website falls under University of Illinois copyright and intellectual property rights. For a detailed statement, please see the University of Illinois Copyright Information and Policies here.