


Historical View of U.S. Row Crop Acreage
The most recent baseline from the USDA indicates a projected decline in acres planted to major row crops in the U.S. Specifically, acres planted to major row crops is expected to decline from 248.6 million in 2025 to 241.6 million in 2035, or by 7 million acres. Projected acres in 2035 is 9.1 million below the average of 250.7 million acres since 1986 (see farmdoc daily from April 6, 2026). Today’s article provides some longer-term historical context for U.S. acreage planted to major row crops with a focus on the relative stability in row crop acres since the mid-1980s.
U.S. Row Crop Acreage Trends
Figure 1 shows acreage planted to major row crops in the U.S. from 1930 through 2025, supplemented with projections from USDA’s most recent baseline projections for 2026 through 2035. A rolling 5-year average is also included in Figure 1 to more clearly illustrate historical changes and trends in row crop acres. Major row crops are corn, soybeans, wheat, oats, sorghum, barley, rice, and upland cotton.
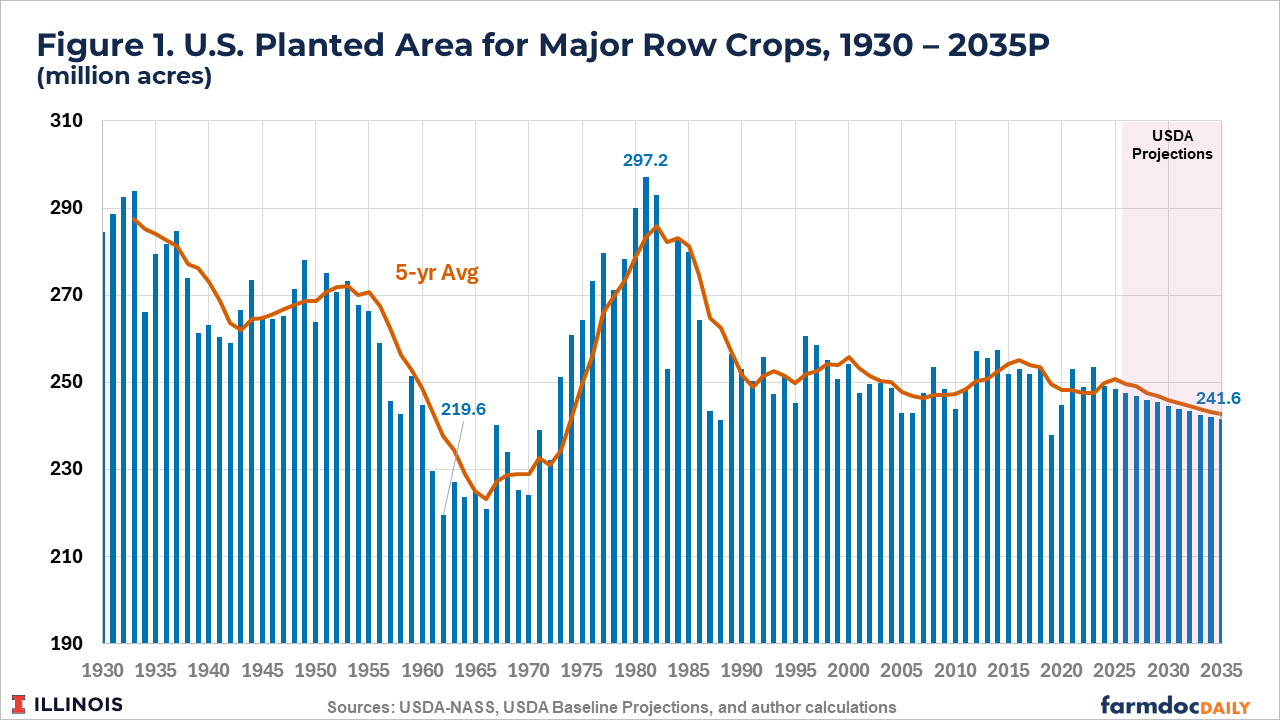
Prior to the mid-1980s, major row crop acres in the U.S. varied from a low of under 220 million acres in 1962 to just over 297 million acres in 1981. The much smaller acreage from the mid-1950s through 1971 was the result of policy decisions to remove acres from production instead of holding excess production in stocks (see farmdoc daily articles from May 30, 2019 and April 9, 2020 ). Prominent policies of this era were the Soil Bank programs of the 1950s and acreage reduction programs of the 1960s, including payment-in-kind and paid set-aside programs.
The surge of acres in the 1970s reflected a multiple year period of crop farm prosperity (1972-1980). A primary reason was the surge in grain exports, initiated by the Russian grain sales in 1972 but furthered by world-wide economic growth and demands for more food, especially meat and animal products. The moderation of this growth and the Russian grain embargo marked the end of this era of prosperity and the ensuing farm financial crisis of the 1980s.
Since 1986, acres planted to major row crops have been relatively stable, averaging 250.7 million acres. Row crop acreage reached 260.6 million acres in 1995. The post-1985 lows are 237.9 million in 2019, a year with a large amount of prevent plant acres, and 241.2 million in 1988, an acreage set-aside and drought year.
Individual Crop Trends
Changes and trends in acreage planted to individual major row crops from the 1930s to the mid-80s varied. Figure 2 shows rolling 5-year averages for acreage planted to corn, soybeans, and wheat since 1933. Corn acreage trended down consistently from more than 100 million acres per year in the 1930s to a low of 65 million acres in 1962. Wheat acreage varied between 60 and 80 million acres through the mid-1950s and then declined to a low of 48.7 million acres in 1970. Corn and wheat acreage again increased during the 1970s before declining during the 1980s farm crisis. U.S. soybean acreage consistently increased from the 1930s through the 1970s, reaching a peak of 71.4 million acres in 1979 before also declining during the 80s farm crisis.
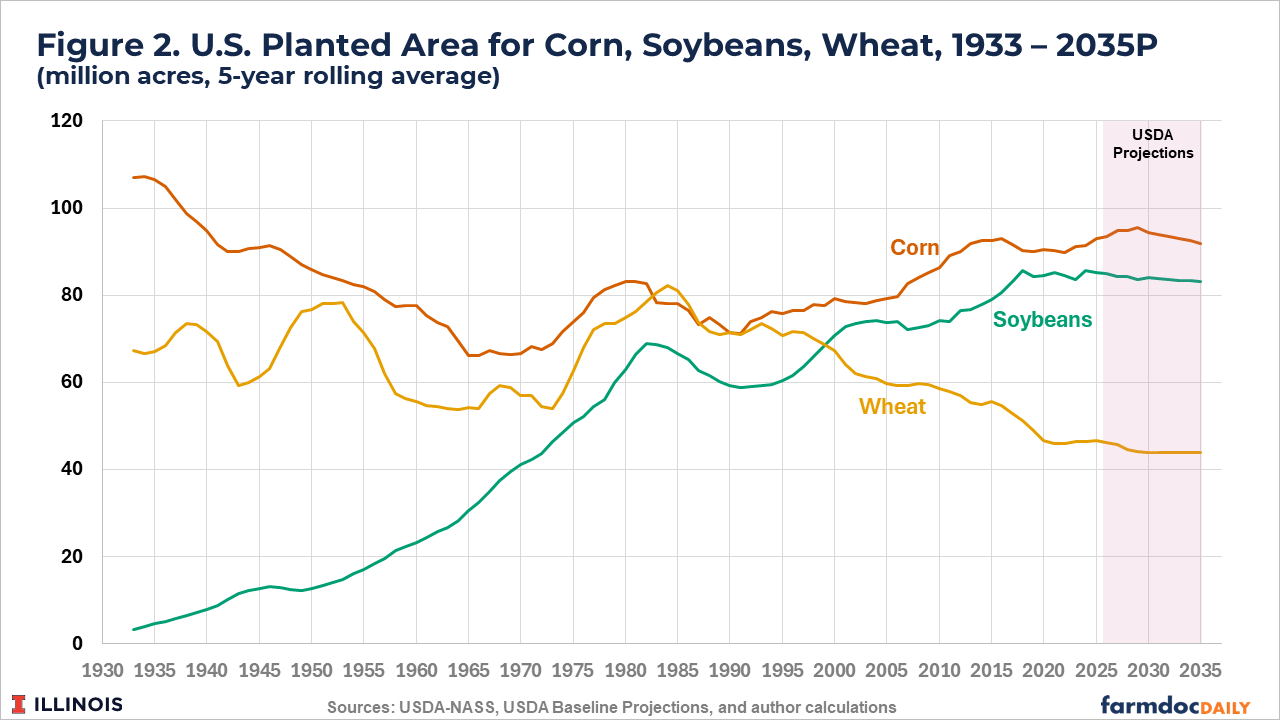
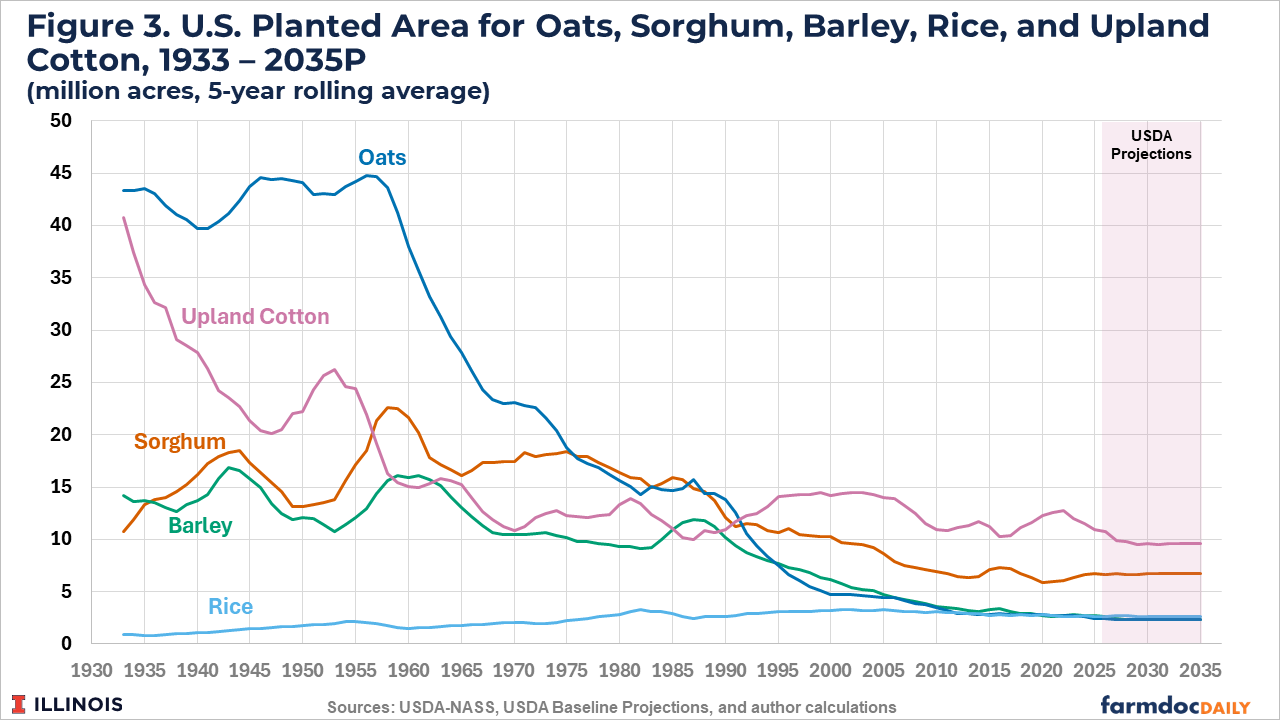
Figure 3 shows rolling 5-year averages for acres planted to the other major row crops since 1933. Oat acreage averaged between 40 and 45 million acres into the 1950s before experiencing a precipitous decline as mechanization displaced the need for horses and mules. From 1933 through the early 1980s, cotton acreage declined significantly from an average of over 40 million to between 10 and 15 million, barley acreage trended down from nearly 15 million to under 10 million per year, sorghum acreage varied around an average of 17.5 million acres per year, and rice acreage trended up from less than 1 million to more than 3 million.
Since the mid-1980s, acreage shifts have occurred via reallocation across the major row crops as total major row crop acres have remained fairly stable (see above discussion). Planting flexibility enacted in the 1996 Farm Bill was also a major factor in acreage reallocation over the past 30 years (further discussion is provided in farmdoc daily articles from March 3 and March 28, 2025).
Corn and soybean acreage both increased following the 1980s farm crisis lows through the mid-2010s, with more pronounced increases during the initial growth of the domestic biofuels industry beginning around 2005. The growth in corn and soybean acreage over the past 40 years contrasts with a consistent decline in wheat acreage from an average of more than 75 million acres in the late-80s to less than 45 million acres over the past 10 years. Acres planted to oats, barley, and sorghum also have declined since 1985, but their decline may be slowing and even stabilizing. Cotton and rice acreage have varied between 10 and 15 million and around 3 million, respectively.
Beyond the policy impacts noted above, much of the acreage changes in feed grains – corn, wheat, barley, oats, and sorghum – can be explained by relative changes in yields and the resulting impacts on profitability. The role of relative productivity changes on the allocation of U.S. crop acres through time will be further explored in a future farmdoc daily article.
USDA Projections to 2035
Baseline projections from the USDA through 2035 are for planted acres to corn, soybeans, and wheat to decline from recent levels. For sorghum, barley, and oats the projections over the next 10 years are at levels similar to what was planted in recent crop years. Rice and cotton acres are projected to be at levels slightly lower than in recent crops years.
The net result on total major row crop acres is a projected decline to 241.6 million acres by 2035. The majority of the decline comes from fewer corn, soybean, and wheat acres. Fewer corn and soybean acres seems a likely and rational response to continued productivity increases and expansion of row crop production in other areas such as South America which seem poised to outpace projected global demand growth (see farmdoc daily article from September 8, 2021).
Summary
Total row crop acres in the U.S. have been relatively stable since the farm crisis of the 1980s. Corn, soybeans, and rice acres have generally increased over that timeframe while acreage planted to other major row crops has declined. Notably, total U.S. grain and oilseed production has continued to increase due to productivity gains and a larger share of U.S. crop acreage being planted to corn and soybeans (see farmdoc daily articles from September 13 and September 22, 2023).
However, USDA’s baseline projects a downward trend towards 241.6 million acres planted to major row crops by 2035. If realized, major row crop acres would be near their lowest level over the past 40 years, with USDA projecting that reductions in corn, soybean and wheat acres will lead the way. For wheat acres this continues a multi-decade trend. For corn and soybeans this would represent a shift from the historical trend towards greater concentration in corn and soybean acres.
Note that USDA’s projections reflect how markets are expected to evolve if policy, technology, and other supply and demand trends in place when the projections are made were to continue. Over the next few months, a series of articles will explore how alternative assumptions, such as potential changes to biofuels policy, could impact longer-run supply and demand outcomes.
References
Coppess, J. "A Brief Review of the Consequential Seventies." farmdoc daily (9):99, Department of Agricultural and Consumer Economics, University of Illinois at Urbana-Champaign, May 30, 2019.
Coppess, J., N. Paulson, G. Schnitkey, C. Zulauf and K. Swanson. "Acres & Crisis: Prospective Plantings and Perspectives from the Past." farmdoc daily (10):66, Department of Agricultural and Consumer Economics, University of Illinois at Urbana-Champaign, April 9, 2020.
Goodrich, R., N. Paulson and G. Schnitkey. "USDA Baseline Points to Declining U.S. Row Crop Acreage." farmdoc daily (6):58, Department of Agricultural and Consumer Economics, University of Illinois at Urbana-Champaign, April 6, 2026.
USDA. 2026. Agricultural Baseline Projections to 2035. https://www.ers.usda.gov/topics/farm-economy/agricultural-baseline. Released February 13, 2026.
Zulauf, C. "An Evolving Path to Declining US Crop Acres." farmdoc daily (11):131, Department of Agricultural and Consumer Economics, University of Illinois at Urbana-Champaign, September 8, 2021.
Zulauf, C., J. Colussi, G. Schnitkey and N. Paulson. "Concentration of US Principal Crop Acres in Corn and Soybeans." farmdoc daily (13):166, Department of Agricultural and Consumer Economics, University of Illinois at Urbana-Champaign, September 13, 2023.
Zulauf, C., G. Schnitkey, N. Paulson and J. Colussi. "Concentration of US Crops in Corn and Soybeans: Importance to Increasing US Production of Grains and Oilseeds." farmdoc daily (13):173, Department of Agricultural and Consumer Economics, University of Illinois at Urbana-Champaign, September 22, 2023.
Zulauf, C., J. Coppess, G. Schnitkey and N. Paulson. "US Corn, Soybean, and Wheat Acres in the Planting Flexibility Era." farmdoc daily (15):40, Department of Agricultural and Consumer Economics, University of Illinois at Urbana-Champaign, March 3, 2025.
Zulauf, C., G. Schnitkey, J. Coppess and N. Paulson. "US Farm Program Crops in the Planting Flexibility Era." farmdoc daily (15):58, Department of Agricultural and Consumer Economics, University of Illinois at Urbana-Champaign, March 28, 2025.
Disclaimer: We request all readers, electronic media and others follow our citation guidelines when re-posting articles from farmdoc daily. Guidelines are available here. The farmdoc daily website falls under University of Illinois copyright and intellectual property rights. For a detailed statement, please see the University of Illinois Copyright Information and Policies here.