








Has Ethanol Changed the Long-Term Growth in Total US Corn Use?
Ethanol has had little-to-no impact on post-1980 growth in total US corn use. This should not surprise. Corn has alternative uses. Policy favoring one use will generate economic responses that reduce growth in other uses. US soybeans may repeat this experience: little-to-no impact on long term growth in total soybean use from policies favoring biofuels.
Total US Corn Use
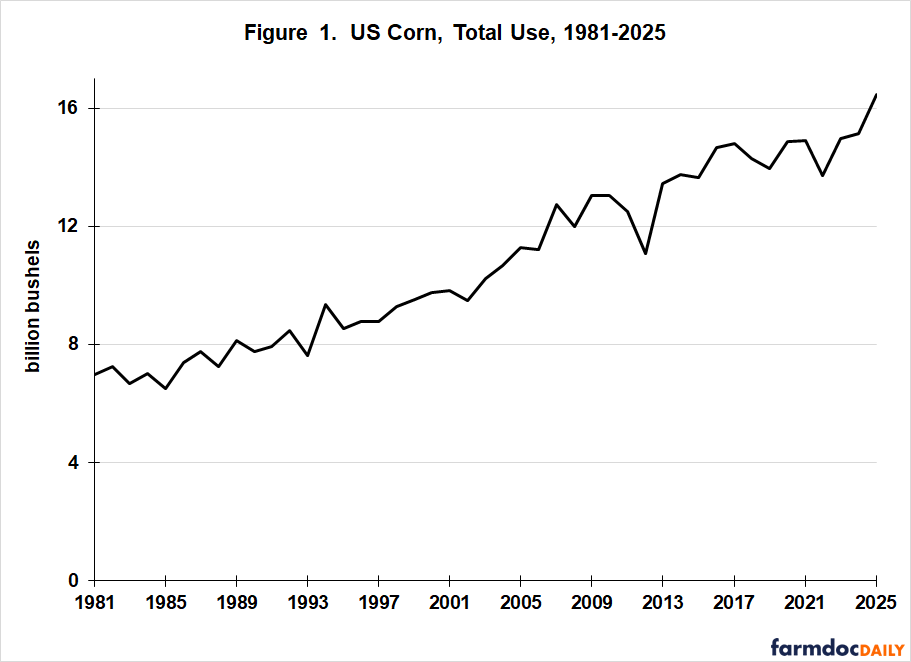
Using data from the US Department of Agriculture, Foreign Agriculture Service Production, Supply, and Distribution (PSD) data base, a strong up trend exists in the total use of US corn since 1985, when a US farm policy decision lowered price support levels to incentivize use (see Figure 1). Figure 1 starts with 1981 because the 1970 period of crop prosperity ended in 1980.
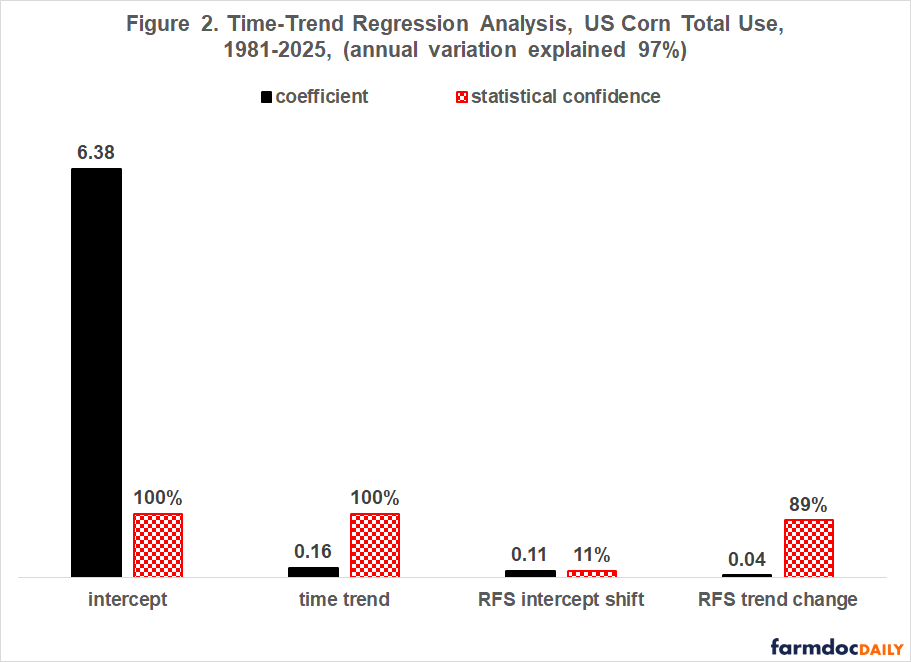
A regression equation composed of a linear time trend plus two variables that reflect the 2005 and 2007 Renewable Fuel Standards (RFS) explains 97% of the growth in total US corn use since 1981 (see Figure 2). One RFS variable is a so-called dummy variable that divides 1981-2025 into 1981-2004 and 2005-2025 subperiods. This variable provides insight into whether RFS is associated with a shift in the level of use. Labeled “RFS intercept shift” in Figure 2, its estimated coefficient differs from zero, i.e. no shift, with only 11% statistical confidence. The other RFS variable is the dummy variable multiplied by the time variable, which is measured as 1 to 45. This variable, “RFS trend change,” provides an indication of whether annual growth in use differed in the two subperiods. Statistical confidence is 89%, below the commonly used 95% for statistical significance. These findings imply that growth in total US corn use before and after RFS has not differed with statistical confidence.
Food-Seed-Industrial (includes ethanol) Use
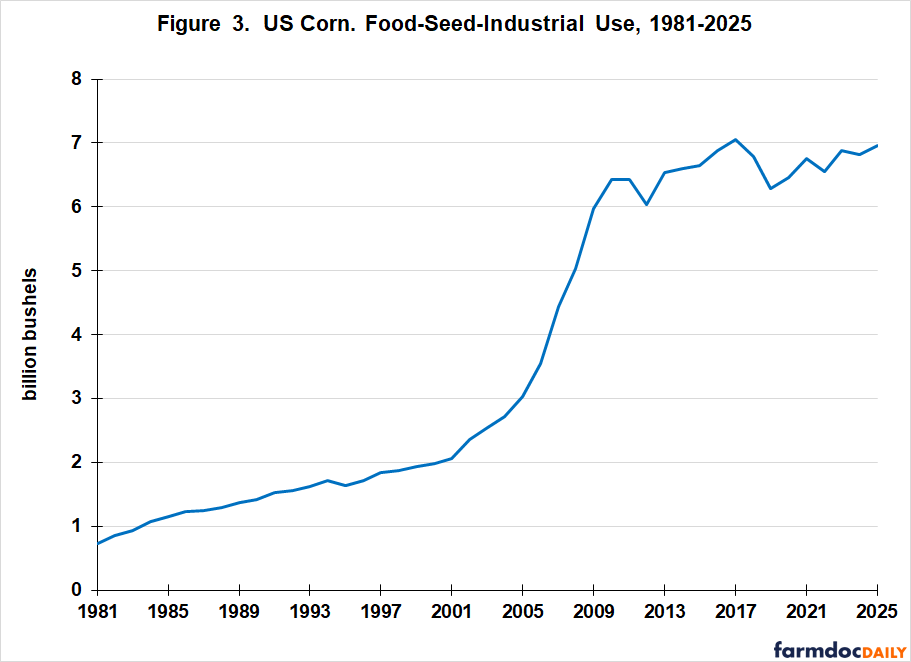
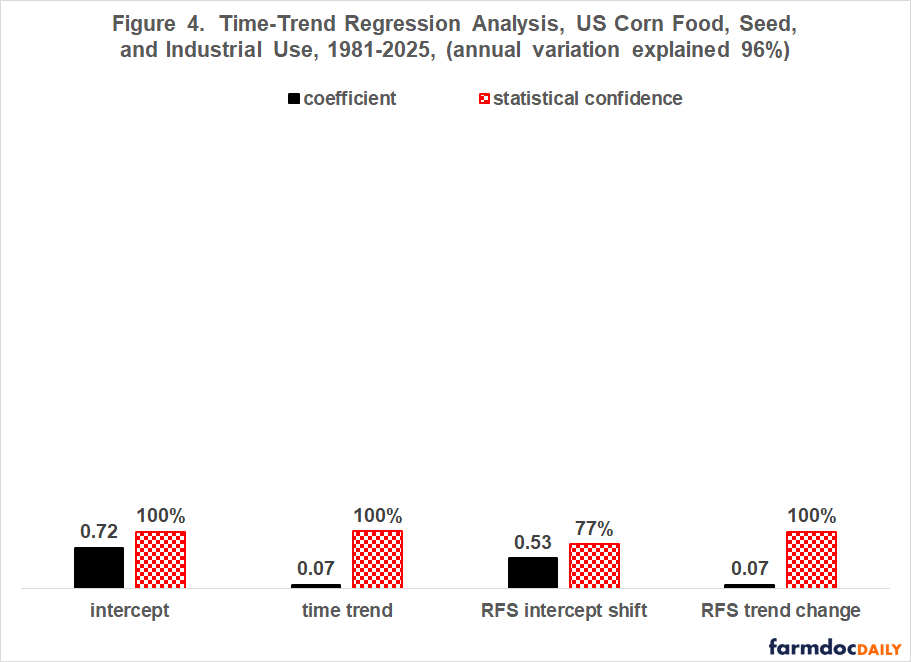
Food, seed, and industrial (FSI) use of US corn more than doubled between 2005 and 2010, from 3.0 to 6.4 billion bushels (see Figure 3). This rapid growth was due to the interplay between the RFS and the ban on use of MTBE as an octane enhancer which predates the RFS. The ban on MTBE reflected concern over its carcinogenic potential. Since 2010, FSI use has increased only 0.5 billion bushels. The time-trend regression finds no statistically significant difference in the intercept in the periods before and after RFS, but annual trend growth has been statistically significantly higher post RFS: 0.14 vs. 0.07 billion bushels in 2005-2025 vs. 1981-2004 (see Figure 4). When combined, these findings suggest that the RFS squeezed longer term growth into a much shorter time (i.e. 2005-2010). For a discussion of the interplay between MTBE, RFS, and ethanol growth, see the farmdoc daily of December 22, 2025.
Feed Use
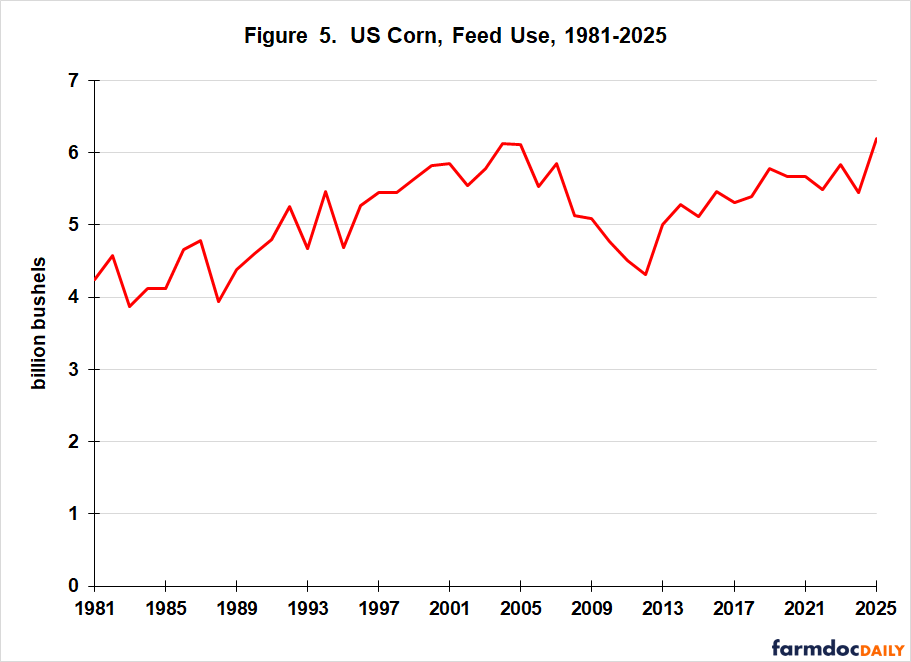
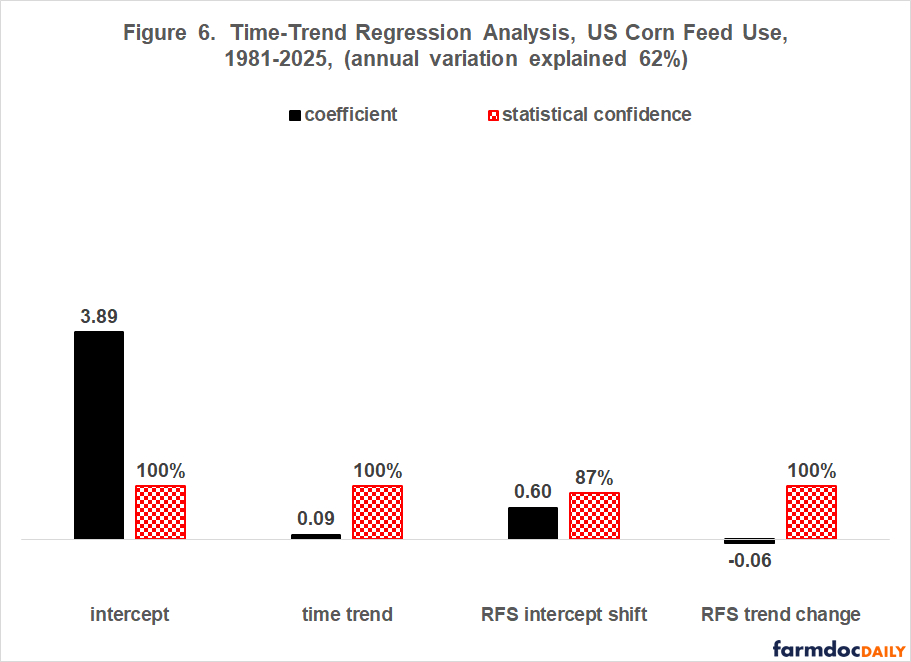
US feed use of corn fell from 6.1 to 4.8 billion bushels between 2005 and 2010 (see Figure 5), offsetting 39% of the growth in FSI use over this period. Feed use for the 2025 crop year is currently forecast at 6.2 billion bushels. If realized, feed use will finally exceed the 6.1 billion bushels fed in 2005 (and 2004). Regression analysis again finds no statistically significant change in the intercept but a statistically significant change in the time trend (see Figure 6). The time trend change is an annual decline in feed use that nearly offsets the time trend increase in FSI use (-0.06 vs. +0.07 billion bushels).
Exports
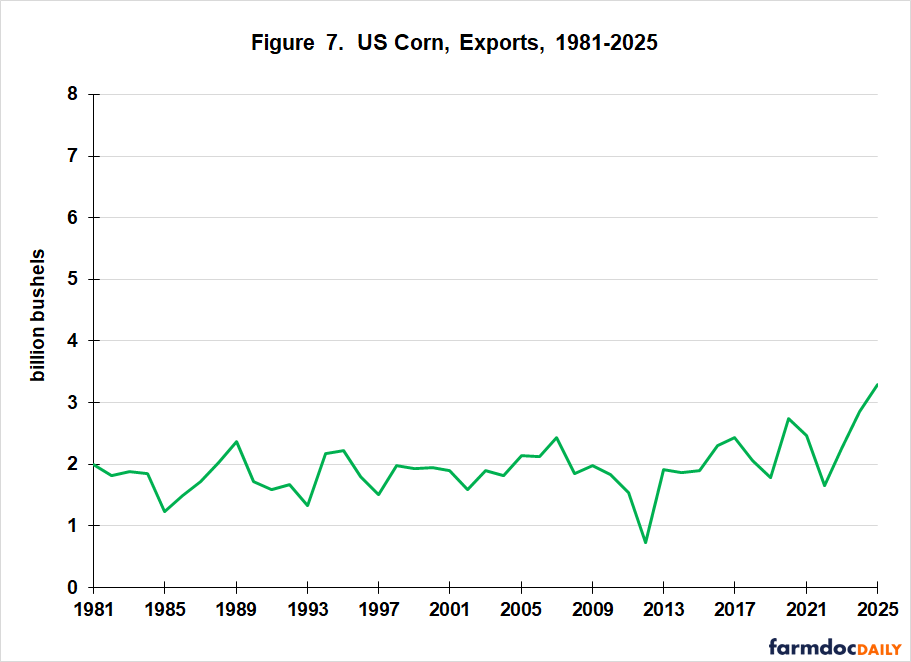
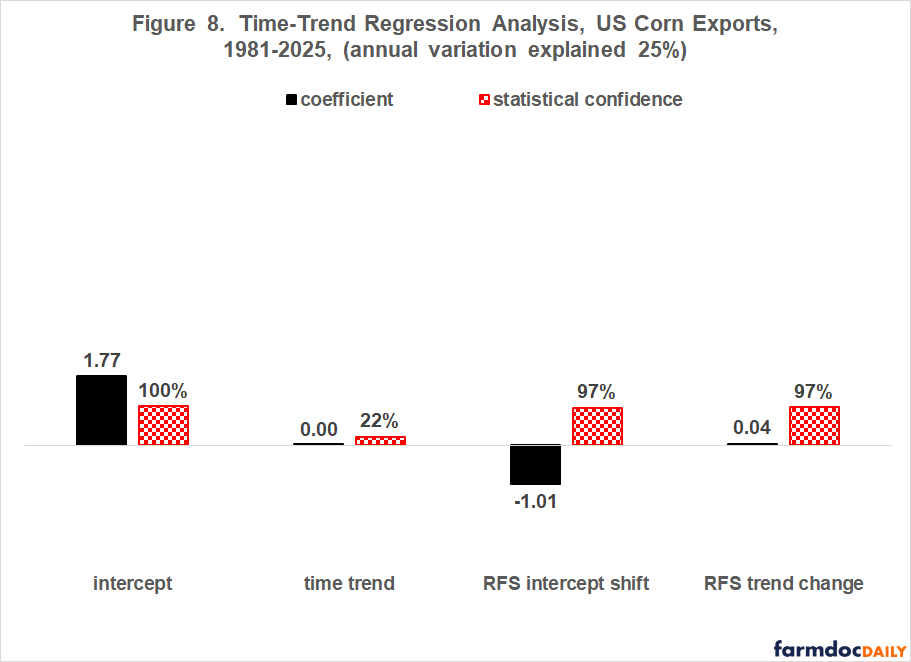
Between 2005 and 2010, US corn exports declined from 2.1 to 1.9 billion bushels. More importantly, from 1981 through 2015, US corn exports only occasionally exceeded the 2.0 billion bushels exported in 1981 (see Figure 7). One interpretation of the no-growth in US corn exports is the long-run negative impact of imposing export embargoes (see farmdoc daily of July 13, 2018). Since 2015, exports have exceeded 2 billion bushels every year except 2019 and 2022 (see Figure 8). They are currently projected at 3.3 billion bushels for 2025. The regression time-trend analysis finds a statistically significant higher growth in exports post RFS, but a statistically significant post RFS intercept that is one billion bushels lower (see Figure 8).
Discussion
It is difficult to pick out the 2005-2010 period of rapid growth in corn ethanol production from a graph of total corn use since 1981. Regression analysis supports this visual difficulty.
The limited impact of US ethanol policy on long run growth in total US corn use should not come as a surprise. Corn has alternative uses. Policy designed to spur one use, such as ethanol, will increase price, slowing growth, even reducing growth, in other uses, such as feed and exports in the case of ethanol.
In other words, US ethanol policy spurred a short-term increase in total US corn demand and price that was not sustainable.
The strong growth in US corn exports since 2010 and especially since 2015 is likely no coincidence as it overlaps with the slow growth in use of corn for ethanol.
A reasonable hypothesis is that the same outcome is likely for recent US policy decisions favoring biofuels for US soybeans: little-to-no discernable impact on the long-term growth in total soybean use, but with the potential for short run increases in total use and price amid major impacts on other uses.
In closing, this is the third in a set of farmdoc daily articles (November 17, 2016, November 20, 2019) documenting the increasing evidence US ethanol policy did not alter long-term growth in total US corn use. The associated implication is that effective demand-enhancing policy needs to respect the private market ‘s organic (non-policy) growth, especially in other uses.
References
Irwin, S. "What Caused the U.S. Ethanol Boom?" farmdoc daily (15):235, Department of Agricultural and Consumer Economics, University of Illinois at Urbana-Champaign, December 22, 2025.
US Department of Agriculture, Foreign Agriculture Service. May 2026. Production, Supply, and Distribution Online. https://apps.fas.usda.gov/psdonline/
Zulauf, C. "Has Ethanol Increased Total US Corn Use?" farmdoc daily (9):219, Department of Agricultural and Consumer Economics, University of Illinois at Urbana-Champaign, November 20, 2019.
Zulauf, C. "US Corn Ethanol Market: Understanding the Past to Assess the Future." farmdoc daily (6):218, Department of Agricultural and Consumer Economics, University of Illinois at Urbana-Champaign, November 17, 2016.
Zulauf, C., J. Coppess, N. Paulson and G. Schnitkey. "U.S. Corn, Soybean, Wheat Exports and USSR Grain Embargo: Contemporary Implications." farmdoc daily (8):129, Department of Agricultural and Consumer Economics, University of Illinois at Urbana-Champaign, July 13, 2018.
Disclaimer: We request all readers, electronic media and others follow our citation guidelines when re-posting articles from farmdoc daily. Guidelines are available here. The farmdoc daily website falls under University of Illinois copyright and intellectual property rights. For a detailed statement, please see the University of Illinois Copyright Information and Policies here.