








Crop Insurance Loss Experience in 2025: More of the Same
For the entire crop insurance program, crop insurance payments relative to total premiums for the 2025 crop year were below the average for the last ten years. Corn and soybeans had lower relative losses than wheat, which had lower relative losses compared to cotton, rice, and peanuts. The relative loss experience across crops in 2025 is typical of historical experience. Moreover, net benefits from crop insurance were lowest in the Midwest compared to other parts of the country. Again, that geographical performance is typical. Overall, 2025 was a typical loss performance year, meaning that greater support was provided to cotton, peanuts, and rice than to corn, soybeans, and wheat.
Loss Performance of all Crop Policies in 2025
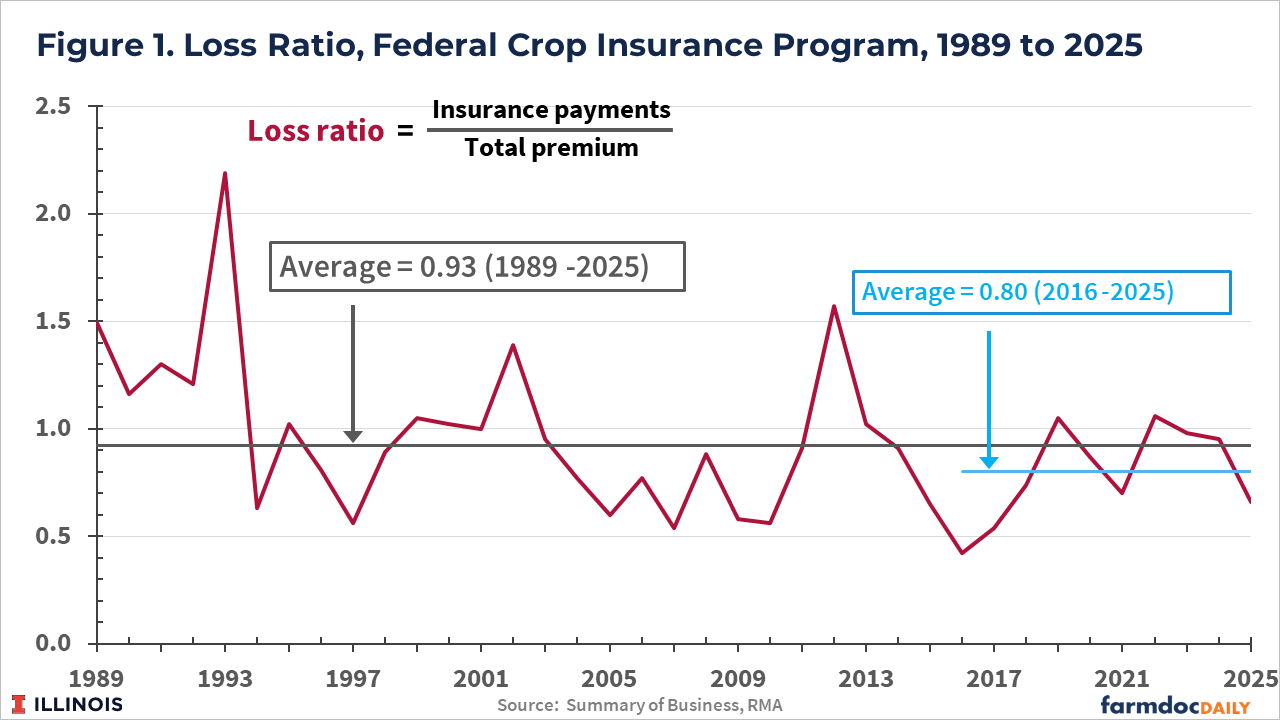
Loss ratios are used to judge crop insurance performance. A loss ratio equals indemnity payments on crop insurance divided by the total premiums paid for crop insurance. Total premiums include those paid by farmers and risk support provided by the Federal government. A loss ratio of 1.0 means that crop insurance payments equal total premiums. Loss ratios above 1.0 mean that payments exceed premiums and vice versa. When it sets premiums, the Risk Management Agency (RMA) aims to maintain a loss ratio slightly lower than 1.0 over the entire program, thereby building a loss reserve. RMA often uses a .88 loss ratio target when setting premiums, representing a 12% loss reserve.
The loss ratio in 2025 was .67. That loss ratio was obtained using data from mid-July in the Summary of Business, a database maintained by the Risk Management Agency (RMA), including all crops and plans (livestock policies are not included). Changes may occur as more losses are recorded in the Summary of Business. Those changes will be small, as payments have been made on most individual farm-level policies, and RMA has released all data to make payments on county-level productions.
The .67 loss ratio for 2025 is below the .88 loss benchmark targeted by RMA. It is also below the longer-term average of .93 from 1989 to 2025 (see Figure 1). The 2025 loss ratio was below the .80 average for the last ten years. Overall, 2025 was a typical year, particularly when compared to the last ten years. If anything, loss ratios have been declining over time (see farmdoc daily articles from July 16, 2024, July 5, 2022, and July 26, 2022).
Loss Experience by Crop in 2025
Loss experience varied by crop. Table 1 shows six row crops that account a large portion of the federal crop insurance program. Note that these row crops also receive the majority of Commodity Title payments. Of those crops, corn had the lowest loss ratio of .40. Corn was followed by soybeans with a .49 loss ratio. Wheat and cotton had loss ratios of .68 and .69, respectively. Rice and peanuts had loss ratios above the average, and above the target set by RMA for setting premiums: 1.08 for peanuts and 2.13 for rice. Loss ratios below and above the target are expected in individual years; average loss ratios through time should be expected to better match the target.
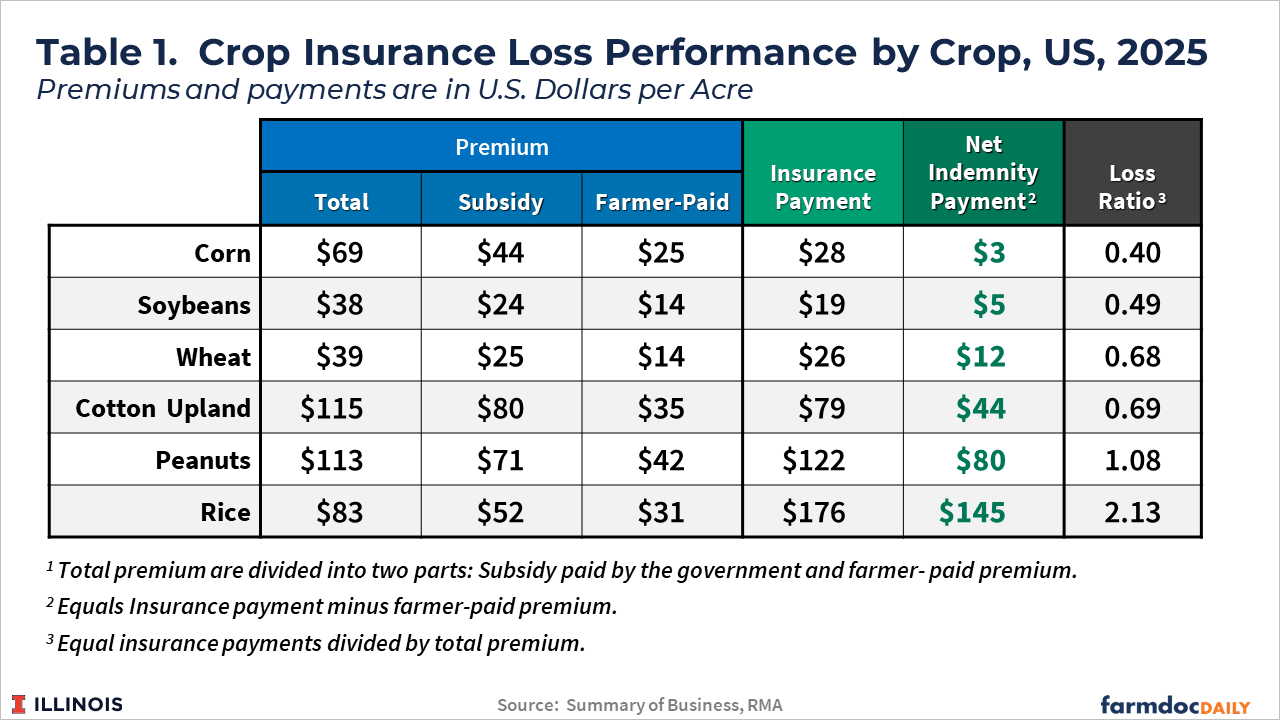
Table 1 also shows premiums, insurance payments, and net indemnity payments. For corn, the total premiums were $69 per acre. That total premium is divided into subsidy and farmer-paid premium. The Federal government pays the subsidy portion. As its name implies, the farmer-paid portion is paid by farmers. Of the $69 total premium, the Federal government provided $44 of premium support, and farmers paid $25 per acre. On average, farmers paid $25 of a $69 premium, meaning that Federal outlays were 65% of the total premium. For corn, insurance payments average $28 per acre. The $28 in payments divided by $69 per acre in payments results in the .40 loss ratio. Net Indemnity payments received by farmers equal insurance payments minus the farmer-paid premium. For corn, the net indemnity payment is $3 per acre, meaning that, as a group, corn farmers received $3 per acre more in payments than they made in farmer-paid premiums from buying crop insurance for corn. Even given the low .40 loss ratio, farmers received more back than they paid in because of Federal premium support.
Of the six crops in Table 1, corn had the lowest net indemnity payments of $3 per acre. Soybean net indemnities were $5 per acre, wheat was $12 per acre, and cotton was $44 per acre. Peanuts had an $80 per acre net indemnity payment, and rice had $145 per acre. Those net benefits followed the same pattern as the loss ratios experienced in 2025.
2025 Relative to Historical Experience
Crop insurance performance in 2025 is compared to historical experience for different time-periods:
- 2006 to 2025 — the last twenty years, roughly corresponding to the modern crop insurance program,
- 2006 to 2015 – is the first ten years of the twenty-year period, and
- 2006 to 2025 – the previous ten years.
The two ten-year periods are included to see if recent history differs from more distant history.
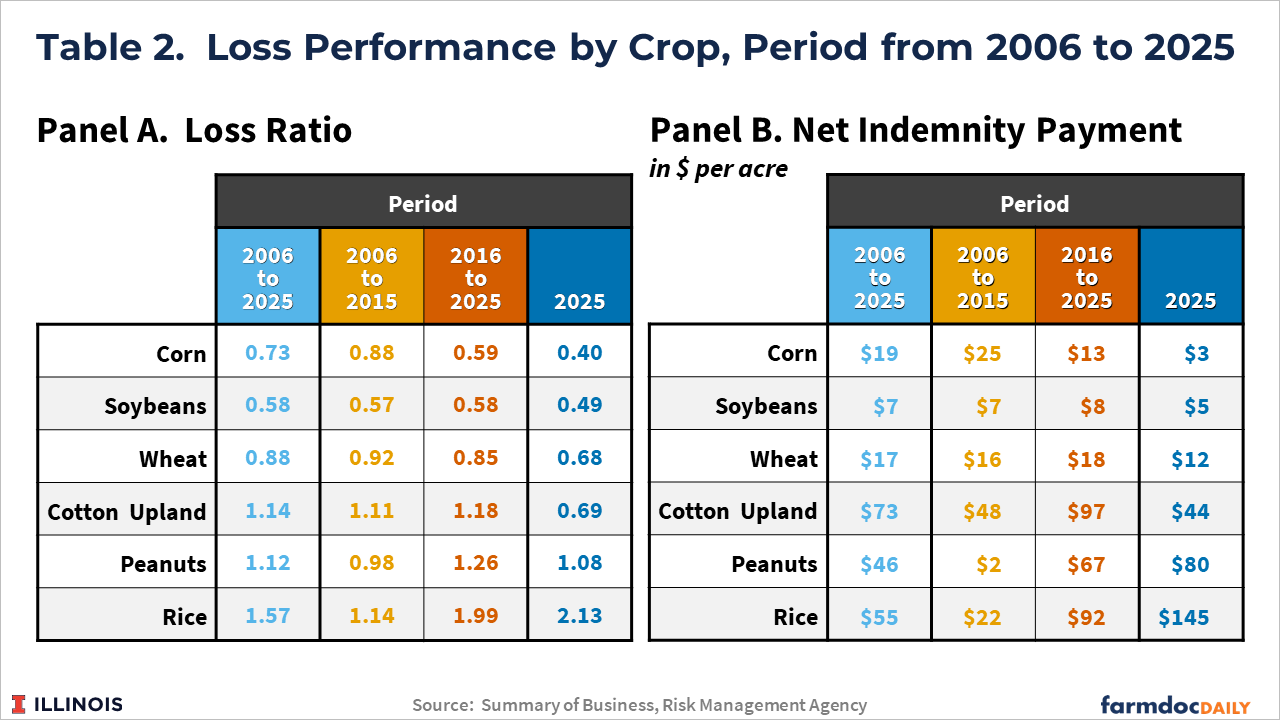
The relative performance ranking by crop remains the same for the four time periods in Table 2.
- Corn and soybeans have the lowest loss ratios in 2025 (.40 for corn and .49 for soybeans). Similarly, they have the lowest loss ratios for the entire twenty-year period (.73 for corn and .58 for soybeans). Corn and soybeans have the lowest loss ratios for the 2006 to 2015 period (.88 for corn and .57 for soybeans) and the 2016 to 2025 period (.59 for corn and .58 for soybeans). That occurs even with the inclusion of the 2012 drought in the 2006 to 2015 and 2006 to 2025 periods. The 2012 drought was one of the worst in the last 100 years.
- Wheat is the next crop between the low group (corn and soybeans) and the high group (cotton, rice, and peanuts). Wheat has a .68 loss ratio in 2025, a .88 loss ratio from 2006 to 2025, a .92 loss ratio between 2006 and 2015, and a .85 loss ratio between 2016 and 2025.
- Cotton, peanuts, and rice have some of the highest loss ratios in 2025 (.69 for cotton, 1.08 for peanuts, and 2.13 for rice). These crops have the highest loss ratios from 2006 to 2025 (1.14 for cotton, 1.12 for peanuts, and 1.57 for rice). The high-loss-ratio crops also had high losses from 2006 to 2015 (1.11 for cotton, .98 for peanuts, and 1.14 for rice) and between 2016 and 2025 (1.18 for cotton, 1.26 for peanuts, and 1.99 for rice).
The results in 2025 conform to the historical pattern of results for crop insurance performance. If anything, in recent times, crop loss performance is diverging:
- Loss ratios for the two of three lowest loss ratio crops (corn, soybeans, and wheat) became lower. For corn, the loss ratio decreased from .88 in 2006 to 2015 to .59 in 2016 to 2025. Soybeans have remained low at .57 and .58 (see farmdoc daily article from January 17, 2023 for further discussion of issues with soybeans). Wheat has decreased from .92 to .85.
- On the other hand, the average loss ratios for the three highest crops have increased. Cotton went from 1.11 in 2016 to 2015 to 1.18 in 2016 to 2025. Peanuts increased from .98 to 1.26. Rice had an extremely large increase from 1.14 in 2006 to 2015 to 1.99 in 2016 to 2015.
While the program overall has achieved a .68 loss ratio over the last ten years, below the .88 target, not all crops have had similar performance experience. Corn, soybeans, and wheat are below the target while cotton, rice, and peanuts are above the target.
Net insurance benefits follow the same pattern as loss ratios. For the last ten years:
- Corn and soybean producers have received $13 and $8 in net indemnities, respectively.
- Wheat producers have received $18 per acre.
- Cotton, rice, and peanut producers have received $97, $92, and $67 per acre, respectively.
During the previous ten and twenty years, the crop insurance program has provided a great deal of support to cotton, rice, and peanuts. That support increased incomes on those farms. Base acres in those three crops also are projected to receive a great deal of support from the Commodity Title programs (see farmdoc daily article from May 20, 2025)
2025 Loss Experience Across Counties
Corn and soybeans are the predominant crops planted in the Midwest. As a result, the Midwest has some of the lowest loss ratios and net indemnity benefits. As shown in Figure 2, the Midwest had the lowest net benefits in 2025 (Panel A) and has averaged the lowest net benefits of any part of the country from 2016 to 2025 (Panel B).
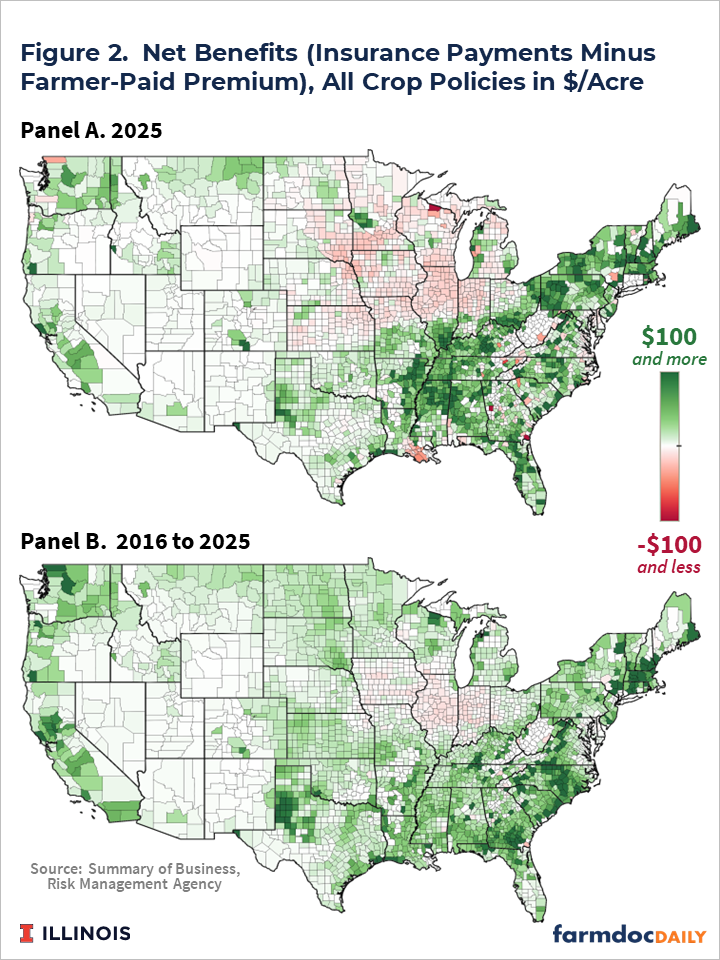
Note that many counties in the Midwest had negative net indemnity payments in both 2025 (Panel A) and over the last ten years (Panel B). For the nation, corn and soybeans typically have positive net indemnity payments, as shown in the previous tables. However, these are not evenly distributed across regions. Loss ratios and net benefits are lower in the Midwest. Besides being crop-oriented, RMA’s premium setting leads to lower loss ratios in the Midwest for corn and soybeans than for the nation as a whole.
Summary
From a loss performance perspective, 2025 was a fairly typical year. Across all crops, the average loss ratio for crop policies was below the last ten-year average. Corn and soybeans had lower relative loss performance than wheat, cotton, rice, and peanuts, as is typical. The Midwest had lower loss performance in 2025, as is typical.
The 2025 performance reinforces the historical differences in loss performance across crops and regions. The program has been more consistently below its target loss ratio of .88 for corn, soybeans, and wheat over the past twenty years. It has been more consistently above the target for cotton, rice, and peanuts. As a result, net benefits have been relatively lower for corn, soybeans, and wheat policies than for cotton, rice, and peanuts.
These rating differences result in corn, soybean, and wheat having much lower net benefits than cotton, rice, and peanuts. With changes resulting from the One Big Beautiful Bill Act (OBBBA) encouraging even more crop insurance use through higher subsidy rates, particularly for area supplemental programs such as the Supplemental and Enhanced Coverage Options, one can expect the experiences in net indemnity payments to increase over time.
References
Schnitkey, G., B. Sherrick, C. Zulauf, J. Coppess and N. Paulson. "Crop Insurance Loss Performance in Illinois and the Midwest." farmdoc daily (14):131, Department of Agricultural and Consumer Economics, University of Illinois at Urbana-Champaign, July 16, 2024.
Schnitkey, G., C. Zulauf, K. Swanson, N. Paulson and J. Baltz. "The 2021 Crop Insurance Loss Performance." farmdoc daily (12):100, Department of Agricultural and Consumer Economics, University of Illinois at Urbana-Champaign, July 5, 2022.
Schnitkey, G., C. Zulauf, N. Paulson, K. Swanson and J. Baltz. "Crop Insurance Performance by Crop Persists Over Time." farmdoc daily (12):110, Department of Agricultural and Consumer Economics, University of Illinois at Urbana-Champaign, July 26, 2022.
Schnitkey, G., N. Paulson, C. Zulauf and J. Coppess. "Spending Impacts of PLC and ARC-CO in House Agriculture Reconciliation Bill." farmdoc daily (15):93, Department of Agricultural and Consumer Economics, University of Illinois at Urbana-Champaign, May 20, 2025.
Schnitkey, G., C. Zulauf, N. Paulson and J. Baltz. "Crop Insurance for Soybeans: The Low Loss Ratio Concern." farmdoc daily (13):8, Department of Agricultural and Consumer Economics, University of Illinois at Urbana-Champaign, January 17, 2023.
Disclaimer: We request all readers, electronic media and others follow our citation guidelines when re-posting articles from farmdoc daily. Guidelines are available here. The farmdoc daily website falls under University of Illinois copyright and intellectual property rights. For a detailed statement, please see the University of Illinois Copyright Information and Policies here.