








Updates from the Policy Design Lab: Crop Insurance and Soybeans
The Senate Committee on Agriculture, Nutrition, and Forestry reported the Agriculture Act of 2026, the unfinished business of the Farm Bill, on September 16, 2026 (Farm Policy News, September 17, 2026; C-SPAN, September 16, 2026). The vote was 12 to 11 to report the legislation, and it was a party-line vote (Republicans in favor, Democrats opposed). The outcome highlights further that the controversies of last year’s Reconciliation Farm Bill continue to complicate this year’s unfinished business, especially the changes to the Supplemental Nutrition Assistance Program (SNAP, formerly Food Stamps) (Martichoux, July 22, 2026; Malicoate, September 22, 2026). With a recess for the mid-term elections rapidly approaching, there is little time and less expectation for Congress to finish the work on this legislation before an expected lame duck session after the election (Yilek, Watson, and Brown, September 17, 2026; Razor, September 22, 2026). With ample time to consider the future of the Farm Bill, this article reviews two updates to the Policy Design Lab visualization project for crop insurance and a storyboard for soybeans.
Discussion
Launched in 2022, the Policy Design Lab at the University of Illinois at Urbana-Champaign is a project to advance understanding of policy design. Among other things, the project applies research, data, and computational resources to visualize the impacts of policies. The project involves developing web-based resources in which to explore and analyze existing policies and, eventually, policy alternatives or design innovations. The project works from statutory and legislative text to incorporate and apply research, publicly available data, and computational resources for analysis and visualization efforts, guided by statutory provisions or legislative options to produce comparative analysis. One goal of the project is to advance understanding about existing policies, as well as research-backed analysis of alternative designs or innovative designs (see, https://policydesignlab.ncsa.illinois.edu/; farmdoc daily, December 21, 2023).
(1) Crop Insurance Updates
The updates for crop insurance refine the crop insurance visualizations, allowing users to view data at the county level, by major commodity (corn, cotton, sorghum, peanuts, rice, soybeans, wheat, and a combined all other commodities), and for each year or combination of years from 2014 to 2024. Figure 1 is the landing page for this visualization at the net farmer benefits for 2024, all commodities (https://policydesignlab.ncsa.illinois.edu/cropinsurance?map=net-farmer-benefits&level=county). All data visualized has been downloaded from the USDA, Risk Management Agency website and primarily from the summary of business application (https://public-rma.fpac.usda.gov/apps/SummaryOfBusiness).
Figure 1. Crop Insurance Landing Page, Policy Design Lab
Interactive visualization:
Policy Design Lab, University of Illinois
Users can select any number of years between 2014 and 2024, as well as individual commodities or combinations of crops. The map also continues the options to review data for loss ratios, liabilities, policies, total premium and premium subsidy, as well as total indemnities. Below the map is a table of the data visualized in the map, and the data can be downloaded for further review and analysis.
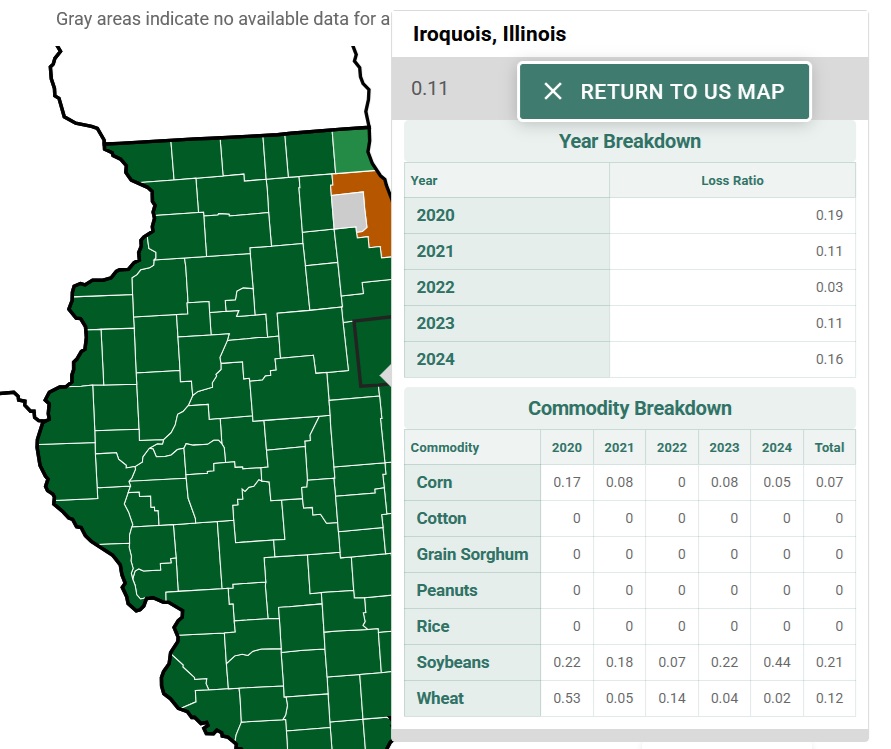
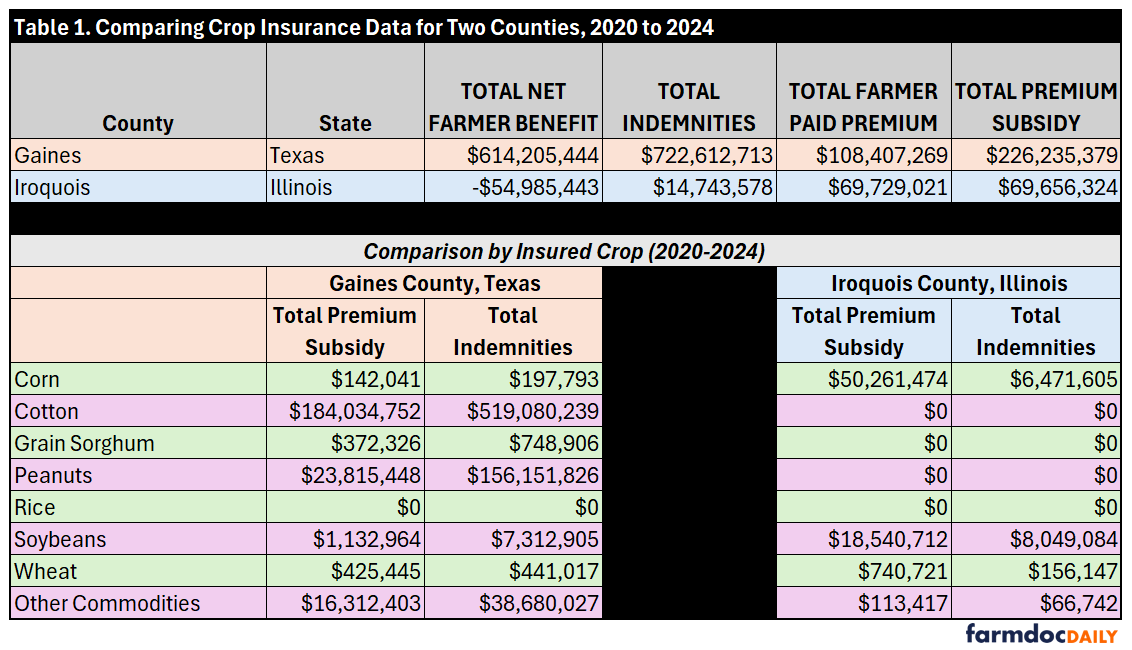
Users can also select how the table is presented, such as ranking the counties by total net farmer benefit. In 2024, Gaines County, Texas had the highest net farmer benefit for all crops at $145.7 million, while Iroquois County, Illinois had the lowest at -$8.9 million. Selecting the most recent five years (2020-2024) returns the same results, with Gaines County at a total of $614 million in net benefits, while Iroquois County remains the lowest at just under -$50 million. To better understand these net benefit differences, users can select the loss ratio tab and then individual commodities for those years. Figures 2a and 2b provide screenshots of the loss ratios for these two counties.
Figure 2a. Screenshot of Gaines County, Texas Loss Ratios
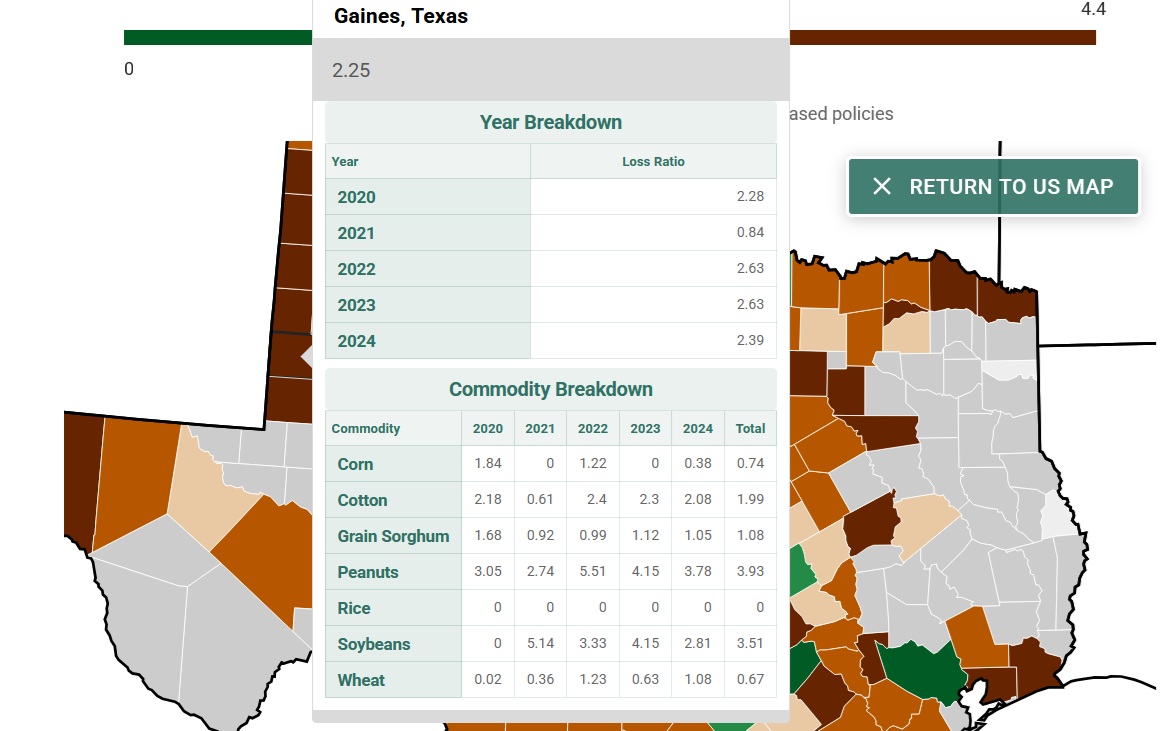
Figure 2b. Screenshot of Iroquois County, Illinois Loss Ratios
Notably, there were an average of 565,600 acres insured in Gaines County from 2020 to 2024, compared to 586,300 average acres insured in Iroquois County. Downloading additional data to compare these two counties helps further explain the differences in net crop insurance benefits. Table 1 summarizes the comparison from the downloaded data.
(2) Introducing the Soybean Storyboard
Soybeans are the second largest crop in the United States in terms of acres planted; second only to corn, with which it is often planted in rotation (e.g., corn one year followed by soybeans the next). U.S. farmers have planted nearly 85 million acres to soybeans in recent years. In terms of federal policy, however, soybeans are in a relatively unique position. The crop was added to federal support programs in 2002, and consistently receives the lowest level of payments while also experiencing relatively few losses in the federal crop insurance program (farmdoc daily, January 18, 2024; September 5, 2024). Soybeans have received additional attention in recent years due to trade conflicts and other geopolitical challenges; at the same time, soybeans are important sources of food, livestock feed, and increasingly fuel.
The soybean storyboard tab in the Policy Design Lab site (https://policydesignlab.ncsa.illinois.edu/soybean-storyboard) seeks to provide an interactive visualization about soybeans with a goal of developing a better understanding of the issues facing soybean farmers. Eventually, this project will seek to develop and visualize analysis of various policy design alternatives, options, and innovations. The work has been funded in part by the Illinois Soybean Association and is part of ongoing efforts at understanding policy design. Data has been compiled from USDA, as well as from the United Soybean Board’s Marketview Database (https://marketviewdb.unitedsoybean.org/). The landing page for the soybean storyboard is included as Figure 3.
Figure 3. Soybean Storyboard
Users can scroll through the storyboard, beginning with the global trade in soybeans. Selecting among the years 2022 to 2025 for global trade data, highlights the imports by China and exports to China by the U.S., Brazil, and Argentina. Below the global trade graphic are a series of visualized data about China that helps explain that country’s demand for soybeans. Below that are visualizations of data about Brazil’s soybeans production in recent years.
The second tab takes users through visualizations of the U.S. soybean market. It begins with the acreage planted to soybeans, including interactive maps of acres planted to soybeans. Below that, is a graphic illustrating U.S. harvested soybean utilization by major categories. Future developments will seek to bring in data on policies, visualizing the support for soybeans. Eventually, the goal is to develop and analyze innovations in policies for soybean farmers, visualizing the results.
Concluding Thoughts
The Policy Design Lab project recently released two updates to the web-based policy visualizations. The first includes further developments for crop insurance, allowing users to visualize data at the county level and by year and/or by crop. The second is a storyboard for soybeans, visualizing background information on soybeans trade and utilization. The Illinois Soybean Association helped support the development of the soybeans storyboard. Both demonstrate advancements in the project, as well as its developmental progress and further refinement. Combined, they also provide some markers for future developments and advancements. For example, moving from the soybean storyboard back to the crop insurance maps allows interested users to see that from 2020 to 2024, soybeans received total net farmer benefits exceeding $4.3 billion. This is about half the net farmer crop insurance benefits for corn ($8 billion) and cotton ($8.2 billion), but similar to wheat ($4.95 billion). For soybeans policies, these visualizations and data are the foundation upon which policies can be further analyzed and, eventually, policy design alternatives and innovations can be analyzed and visualized.
For the Policy Design Lab project, future developments will return to conservation policies with visualizations of data at the county level. Those updates will be followed by further refinements in terms of additional years of data and more. The visualization and web interface developments continues to be the work of outstanding programmers, developers, database experts, and designers at the National Center for Supercomputing Applications (NCSA) at the University of Illinois, Urbana-Champaign.
Appendices
Coppess, J. "Taking Stock: Policy Design Lab After One Year of Development." farmdoc daily (13):232, Department of Agricultural and Consumer Economics, University of Illinois at Urbana-Champaign, December 21, 2023.
Coppess, J. "Farm Policy and the Brief Saga of Soybeans, Part 2." farmdoc daily (14):13, Department of Agricultural and Consumer Economics, University of Illinois at Urbana-Champaign, January 18, 2024.
Coppess, J. "A Tale of Two Oilseeds: Soybean Saga, Part 3." farmdoc daily (14):161, Department of Agricultural and Consumer Economics, University of Illinois at Urbana-Champaign, September 5, 2024.
Hanrahan, Ryan. “Ag Committee Advances Farm Bill 2.0 to Uncertain Future in Full Senate.” Farm Policy News, September 17, 2026. https://farmpolicynews.illinois.edu/2026/09/farm-bill-2-0-advances-to-uncertain-future-in-full-senate/.
Malicoate, Kati. “The cost of cutting SNAP goes beyond the dinner table.” OKPolicy.org. Oklahoma Policy Institute. September 22, 2026. https://okpolicy.org/the-cost-of-cutting-snap-goes-beyond-the-dinner-table/.
Martichoux, Alix. “41 states at risk of losing federal SNAP funds, new data shows: What to know.” The Hill.com. July 22, 2026. https://thehill.com/homenews/state-watch/5981659-41-states-at-risk-of-losing-federal-snap-funds-new-data-shows-what-to-know/.
Razor, Calen. “Capitol agenda: Senate GOP eyes exit plan as trail calls.” Politico.com. September 22, 2026. https://www.politico.com/live-updates/2026/09/22/congress/senate-gop-eyes-exit-plan-01086902.
Yilek, Caitlin, Kahtryn Watson, Jaala Brown. “House cancels votes, cutting week short before adjourning until after midterms.” CBS News.com. September 17, 2026. https://www.cbsnews.com/news/house-cancels-votes-adjourning-midterms/.
Disclaimer: We request all readers, electronic media and others follow our citation guidelines when re-posting articles from farmdoc daily. Guidelines are available here. The farmdoc daily website falls under University of Illinois copyright and intellectual property rights. For a detailed statement, please see the University of Illinois Copyright Information and Policies here.