








The 45Z Biofuel Tax Credit, Part 4: Inside the Updated USDA Feedstock Carbon Intensity Calculator
In September, USDA released the updated version of its Feedstock Intensity Calculator (FD-CIC) for the 45Z Clean Fuel Production Tax Credit (USDA, FD-CIC v.1.2; User Manual, September 4, 2026). This article reviews the updated calculator and discusses its implications for farmers producing feedstock for biofuels production. The article builds on earlier articles in this series (farmdoc daily, May 27, June 18 and July 31, 2026). Most importantly, the changes discussed in this article replace or update the review of the pilot version of the calculator from June, specifically in Figure 2 (farmdoc daily, June 18, 2026). For farmers, USDA has finalized the technical guidelines that govern how farm practices are documented for 45Z purposes (91 FR 39334, June 29, 2026), and Treasury has provided that the 2026 version of the FD-CIC may be used by the biofuel producer for fuel produced in 2025 and 2026 (IRS Notice 2026-53).
Background
Congress created the Clean Fuel Production Tax Credit in the Inflation Reduction Act of 2022, placing it in section 45Z of the tax code (26 U.S.C. §45Z; farmdoc daily, May 27, 2026), and amended it in the One Big Beautiful Bill Act of 2025 (P.L. 119-21). USDA and IRS completed their respective rules for the tax credit, and USDA released an official version 1.0 of the FD-CIC on June 25, 2026. That release has been followed by three updates: version 1.1 (August 18), version 1.1.1 (August 21) and version 1.2 (September 11). Version 1.2 is available in two identical forms: the Excel workbook and a web tool (https://www.usda.gov/usda-fdcic/webtool) that runs in a browser with nothing to download. Producers are encouraged to try the web tool for one of their own fields, using this year’s yield and nitrogen rate.
Generally, the final rule sets practice standards for tillage, cover crops, nutrient management, nitrification inhibitors and manure (7 CFR §2100). Producers must keep records of their FD-CIC inputs and outputs and of how each practice was carried out. These records are subject to audit by third-party, accredited verifiers and must be kept for five years.
Discussion
In the tool, farmers enter the field location (individual fields or multiple fields if using the same management practices and crops) with acres, yield information (actual and expected) and total synthetic nitrogen applied per acre. Farmers also enter whether there is a cover crop, the tillage practice and whether nitrogen inhibitors were used, as well as whether manure was applied and specific details if it was. Based on the information entered, the calculator returns a Carbon Intensity (CI) score for the field or management unit, as well as details about how the overall CI score was reached. The discussion that follows helps explain further how that CI score is calculated by revisiting the Illinois counties from Part 2 (farmdoc daily, June 18, 2026).
Producers who have used the earlier version of the tool will notice, among other changes, that the tool requires more field or management unit level inputs beyond field’s location information. Each enrolled field also requires its actual yield, its expected yield (usually the field’s actual production history, or APH yield in the federal crop insurance program), and the total synthetic nitrogen applied per acre. Table 1 summarizes the differences in the most recent version of the FD-CIC, version 1.2. Users will notice that the current tool reports a separate CI score for each enrolled field, which USDA calls a management unit. By comparison, the pilot reported one whole-farm CI score, averaged across fields and weighted by the bushels each field produced. The list of recognized practices, the crops covered and the reference point against which a score is compared also changed, as discussed below.
Table 1. Main Differences between the Pilot and Current Versions of USDA FD-CIC
| Pilot version (Jan. 2025) | Current version (v1.2, Sep. 2026) | |
| Producer inputs | State and county of each field; practices selected from a list | For each enrolled field: state and county, practices, actual yield, expected yield (usually the APH yield), and total synthetic nitrogen applied per acre |
| CI output | One whole-farm CI score, averaged across fields and weighted by bushels produced | One CI score for each enrolled field (management unit) |
| Recognized practices | Cover crop, no-till, reduced till, nitrification inhibitor (yes or no), split in-season nitrogen, spring-only nitrogen | Cover crop, grazed cover crop, no-till, reduced till, share of nitrogen with a nitrification inhibitor (0 to 100%), manure application, and a lower nitrogen rate; split in-season and spring-only nitrogen removed |
| Crops | Corn, soybeans, sorghum | Corn, soybeans, sorghum, spring canola |
| Reference points | GREET default (corn: 6,295 g CO₂e/bu) | Estimated national average (corn: 6,020 g CO₂e/bu; soybeans: 7,682 g CO₂e/bu) |
(1) Practices that Reduce Corn CI Score in Illinois
Figure 1 presents a map of the county-level corn CI reductions under the latest version (v1.2) of USDA’s FD-CIC for all Illinois counties, with the reduced CI score relative to the estimated national average for corn (CI score of 6,020). Each map is the CI score reduction for each of four practices: cover crops; no-till; a nitrification inhibitor on all synthetic nitrogen; and a 20% reduction in nitrogen rate (from 200 to 160 pounds per acre). Note that the previous version of the FD-CIC did not allow for a nitrogen-rate reduction input. As default, we assume actual and expected yields of 220 bushels per acre and 200 pounds of nitrogen per acre.
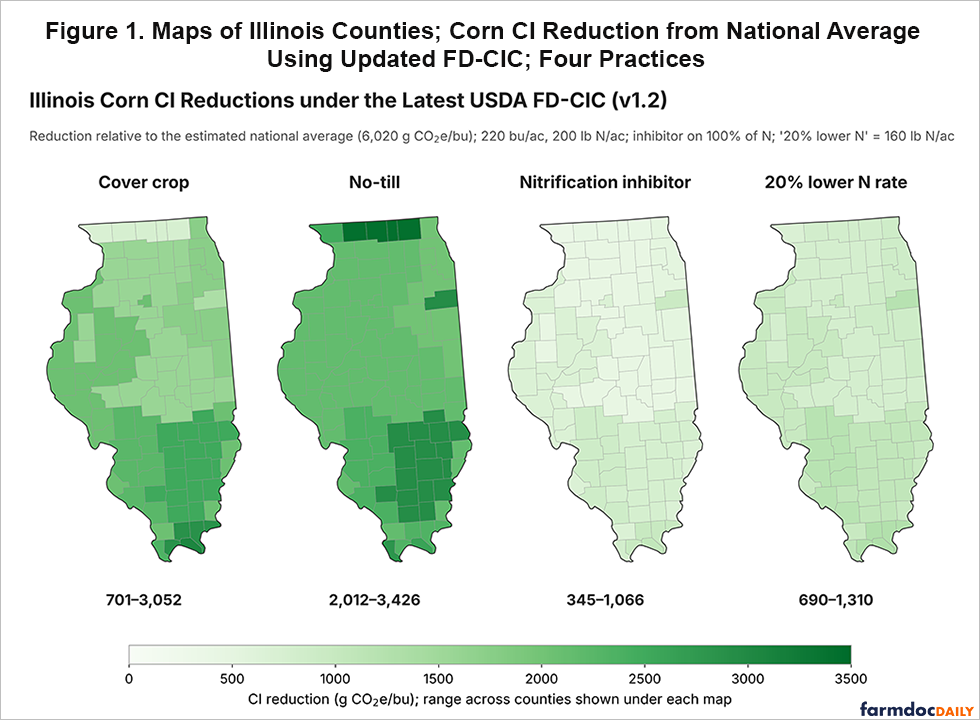
As noted previously, under these model calculations the same practice produces different reductions in different counties. The largest reductions from cover crops and no-till remain in southeastern Illinois, and no-till reductions are also large along the northern border. Future analysis will help explain the differences.
(2) How the CI Reductions Are Calculated
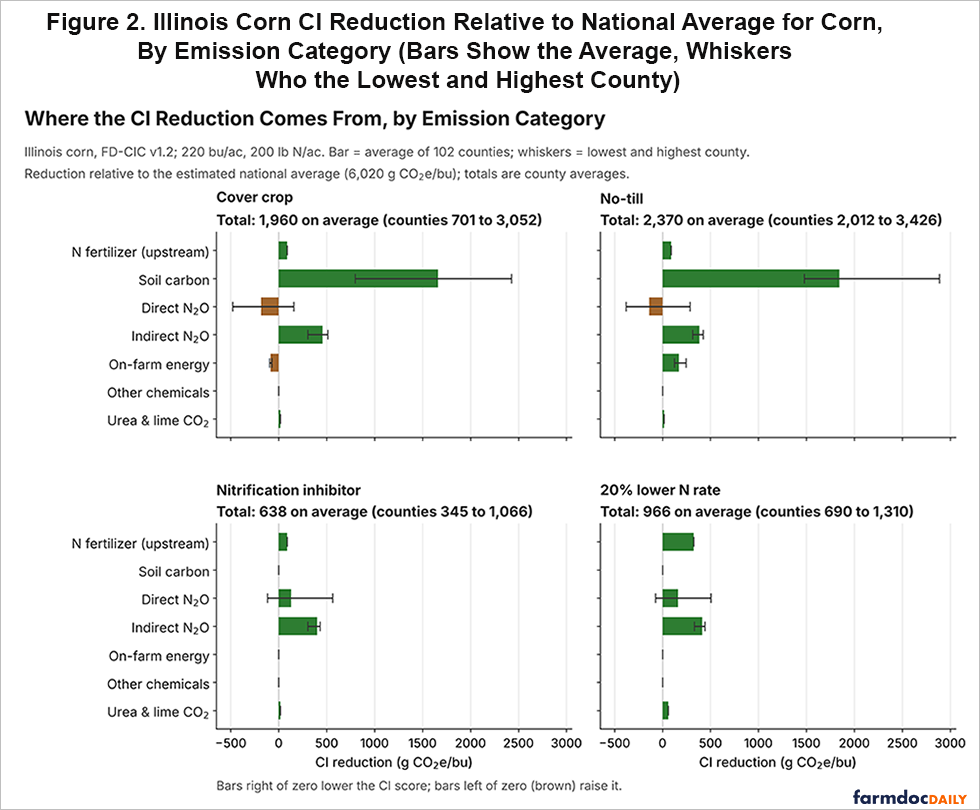
Figure 2 illustrates each practice’s reduction by emission categories. Each bar shows the average across Illinois counties and the whiskers (black line) show the lowest and highest county. The bars add up to the values mapped in Figure 1. For cover crops and no-till, nearly all the reduction comes from soil carbon, which is independent of the crop yield and nitrogen use. Soil carbon is location-dependent, determined by the county in which the field is located: on average 1,662 and 1,846 g CO₂e per bushel. Note also that cover crops add a little fuel use (84 g CO₂e per bushel), while no-till saves fuel (171 g CO₂e per bushel). For the inhibitor and the lower nitrogen rate, the reductions come from N₂O and, for the lower nitrogen rate, also from fertilizer manufacturing and urea, the terms adjusted by crop yield and nitrogen rate. This requires a bit more explanation about how the calculator works.
First, the calculator begins with the individual field (or management unit) entered, which is assigned to a Major Land Resource Area (MLRA) by USDA based upon the field’s location. With the practices selected, USDA uses the DayCent model to simulate the business-as-usual cropping systems and the practice-adopting systems in the MLRA. The results are stored in lookup tables: the change in soil carbon per bushel for each practice, emission factors for nitrous oxide (N₂O) and how practices change them, the effect of practices on fuel use, and the effect of nitrification inhibitors. Because the tables are built by MLRA region, every county in the same MLRA receives the same values. Champaign, McLean and Sangamon Counties in Illinois, for example, fall in the same region and receive identical practice values (USDA, June 2026).
Next, the newly required field-level inputs, namely year and fertilizer use, are used to calculate how much nitrogen the field used per bushel. The tool first sets the yield used in the calculation equal to the actual yield but keeps it within 20% above or below the expected yield. The calculator then divides the total synthetic nitrogen by that yield to get pounds of nitrogen per bushel, which USDA labels nitrogen use efficiency (NUE). Finally, the fertilizer-related emissions are scaled up or down by the field’s nitrogen per bushel relative to the nitrogen per bushel in USDA’s business-as-usual simulations, about 0.98 pounds per bushel for corn (USDA, 2026b). Three emission terms are adjusted this way: emissions from manufacturing and transporting nitrogen fertilizer, N₂O from fertilizer nitrogen, and carbon dioxide (CO₂) released from urea. A field that uses less nitrogen per bushel than the baseline receives lower values for all three, and a field that uses more receives higher values. Nitrogen from manure, if entered, is added to the N₂O calculation in a similar way.
As discussed in Part 2, the theory for CI scoring involves a cradle-to-farm-gate emissions calculation on a per-acre basis and divided by crop yield at field level. This is likely too complex or difficult and was not included in the earlier version. The updated version is an improvement because the crop yield enters only through nitrogen per bushel, so only the fertilizer-related terms respond to it. Soil carbon, N₂O from crop residue, on-farm energy use, other farm chemicals and lime come from the regional lookups or from national averages and do not change with the producer’s yield. Because actual yield is held within 20% of expected yield, an unusually good or poor year can move the score only so far. A record good yield therefore lowers a field’s CI score less than the simple formula would suggest, and a yield loss raises it less. For a given field, the input the producer controls directly is nitrogen use per bushel, while soil-carbon-preserving practices act through the regional calculations.
Finally, indirect N₂O shows a reduction of roughly 390 to 460 g CO₂e per bushel for every practice, including cover crops and no-till. Most of this reflects Illinois’ regional N₂O factors from the MLRA calculation stage. Importantly, that calculation scores indirect N₂O below the national average, rather than the practice itself. The same regional factors score direct N₂O above the national average in many counties, which is why that bar is negative for cover crops and no-till.
(3) Other Notable Changes in the New Version
Several other changes are smaller but worth noting. The reference point moved from the GREET default value used in the pilot (6,295 g CO₂e per bushel for corn) to an estimated national average (6,020 g CO₂e per bushel for corn and 7,682 for soybeans in version 1.2). Both are national averages, and the new value is somewhat lower. Overall, the changes from the latest version are small. Champaign County corn with a cover crop, for example, moved from 4,450 (in v1.0) to 4,439 g CO₂e per bushel (in v1.2).
More useful for producers is that the current tool shows a field’s own business-as-usual score, the score with no practices selected, which the pilot did not report. That score varies with location and nitrogen use and can sit above or below the reference point. For Illinois corn at 200 pounds of nitrogen and 220 bushels per acre, the business-as-usual score ranges from 5,322 to 6,046 g CO₂e per bushel across counties, and one county (Jo Daviess) is above the national average.
Finally, the practice list was revised: split in-season and spring-only nitrogen application were removed. Grazed cover crops, the share of nitrogen treated with an inhibitor, manure application and the nitrogen rate itself were added and now enter the calculation. Spring canola was added to corn, soybeans and sorghum.
Concluding Thoughts
USDA recently released an updated version of its Feedstock Intensity Calculator (FD-CIC) for the 45Z Clean Fuel Production Tax Credit (USDA, FD-CIC v.1.2; User Manual, September 4, 2026). The updated calculator changes the Carbon Intensity (CI) scoring in significant ways. It also includes more information for the user about the scoring process. This article reviewed the CI for corn in Illinois counties, with explanations about how the changes in the calculator result in modified scores.
The updated FD-CIC differs from the previous version in ways that matter for producers. It is field-specific, and each enrolled field needs its actual yield, expected (APH) yield and nitrogen rate. Each field receives its own CI score. The largest reductions come from soil-carbon practices, whose values are set by region, while nitrogen use per bushel is the part of the score that responds to the field’s own records. Location still matters, and every field’s score is reported against the same national reference point. The updated calculator uses an estimated national average CI score (6,020 g CO₂e per bushel) for corn in place of the GREET default value (6,295 g CO₂e per bushel), as well as 7,682 g CO₂e per bushel for soybeans. Notably, in the current version, crop yield and other field inputs, enter the CI calculation only through nitrogen-per-bushel calculations. As such, only the fertilizer-related terms respond to crop yields and producers should not expect their CI score to fall in proportion to yield increases.
The updated version also changes how tillage practices are calculated and documented. The next article in this series will review the tillage components and other matters related to the updated calculator. As before, for example, the model calculations return CI scores that result in different reductions in different counties. The largest reductions from cover crops and no-till, for example, are in southeastern Illinois, and no-till reductions are also large along the northern border.
References
Chen, Z. and J. Coppess. "The Clean Fuel Production Tax Credit (45Z), Part 2: Carbon Intensity." farmdoc daily (16):107, Department of Agricultural and Consumer Economics, University of Illinois at Urbana-Champaign, June 18, 2026.
Chen, Z., J. Coppess and K. Guan. "The Clean Fuel Production Tax Credit (45Z), Part 3: Reviewing the Potential Value." farmdoc daily (16):136, Department of Agricultural and Consumer Economics, University of Illinois at Urbana-Champaign, July 31, 2026.
Coppess, J. and Z. Chen. "The Clean Fuel Production Tax Credit (45Z); Introductory Discussion." farmdoc daily (16):92, Department of Agricultural and Consumer Economics, University of Illinois at Urbana-Champaign, May 27, 2026.
U.S. Department of Agriculture. “USDA FD-CIC Web Tool User Manual.” September 4, 2026. https://www.usda.gov/sites/default/files/documents/usda-fdcic-web-tool-user-guide-092026.pdf.
U.S. Department of Agriculture, Office of the Chief Economist. “Methodology for USDA Feedstock Carbon Intensity Calculator (FD-CIC) as Used in ‘Technical Guidelines for the Production of Regenerative Agricultural Biofuel Feedstocks.’” June 2026. https://www.usda.gov/sites/default/files/documents/usda-fdcic-methodology-062026.pdf.
Disclaimer: We request all readers, electronic media and others follow our citation guidelines when re-posting articles from farmdoc daily. Guidelines are available here. The farmdoc daily website falls under University of Illinois copyright and intellectual property rights. For a detailed statement, please see the University of Illinois Copyright Information and Policies here.