farmdoc daily Turns 10 Today
Exactly 10 years ago today the farmdoc team launched a revolutionary new enterprise. With the smart phone and blogging revolutions in full swing, we made the decision to launch an entirely new website called farmdoc daily. In recognition of the need to stay relevant in a 24/7 news and information environment, we came up with the audacious goal of publishing one article of original analysis on “Corn Belt farm economics” each and every business day. Here we are, 2,383 articles later. Yes, you read that right. We have published an average of 238 articles per year for the last decade. We are, of course, proud of this accomplishment, but we are even prouder that we met the goal while maintaining high standards for timeliness, relevance, and rigor. We know that the quality of articles, not the quantity, is the reason why farmdoc daily has earned a place on the “must read” list of literally hundreds of thousands of farmers, lenders, educators, journalists, traders, market analysts, and policy-makers around the world. In the remainder of this article, we will discuss how the farmdoc daily enterprise is organized and review some data on its impact.
How Do We Do It?
We have been asked many times how in the world we have been able to keep up such an extraordinary pace of publication. It certainly has not been easy! We think there are five factors that play a key role:
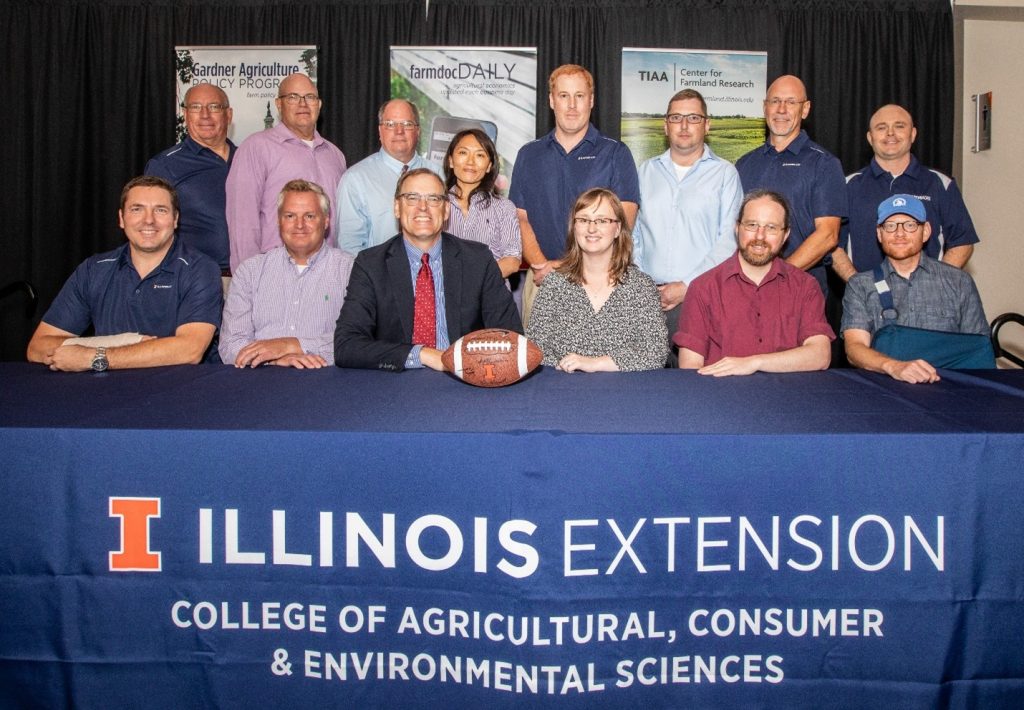
#1. Team. There is no farmdoc daily without the team of extraordinarily talented individuals that is at the heart of the enterprise. Team members develop the decision tools, create new datasets, and write the articles. Without this “knowledge power” there is no lasting demand for the articles. It is also very important that team members like to write. A lot. In addition, we have been extremely fortunate to have a great staff that does the hard work of putting up the articles every day and managing the farmdoc daily website.
#2. Shared Vision. The farmdoc project has always had a well-defined vision from the very beginning. Our vision is to provide analysis, tools, and data to help commercial farmers in the Corn Belt make better decisions in their operations. The farmdoc daily site reflects the willingness of the farmdoc team to take risks to achieve that vision.
#3. Engagement. Subject-matter specialists on the farmdoc team have to be engaged on a daily basis with the commercial agriculture sector in order to stay relevant and timely. This occurs in myriad ways, including phone calls, emails, media inquiries, social media, and face-to-face meetings and conversations (at least until the last year!). In addition, team members are regularly consulted by government officials regarding a wide variety of policies in agricultural trade, price supports, and biofuels.
#4. Low Overhead. A key priority is to minimize overhead time costs to the subject-matter specialists that write farmdoc daily articles. This helps maximize flexibility and speed of response to changing issues and problems in Corn Belt agriculture. Consistent with this priority, we do not have a formal editorial review system for farmdoc daily articles. Individual team members are 100 percent responsible for quality control. We maintain a group calendar app and team members sign up for slots and then write the articles. This management philosophy is crucial to making farmdoc daily an appealing outlet to busy faculty and staff, particularly those that do not have Extension appointments.
#5. Funding. An effort on the scale of farmdoc daily requires significant financial resources. The annual budget for the entire farmdoc project is now about $250,000 per year (not accounting for faculty time), and the funding base consists of sponsorships, gift funds, grants, and Extension funds. In particular, we are very fortunate to have the annual support of a Corporate Sponsor, the TIAA Center for Farmland Research, and our Platinum Sponsors: Compeer Financial, Farm Credit Illinois, FS Growmark, Illinois Corn, and Illinois Soybean Association. (Information about the farmdoc sponsorship program and the complete list of sponsors can be found at this link.)
What is the Impact?
There are lots of ways to measure impact and we are actually working to develop new methods that will provide a more rigorous answer to the question of the economic value of farmdoc programs. Here, we are going to stick to some basic indicators drawn from web traffic statistics for the farmdoc daily site.
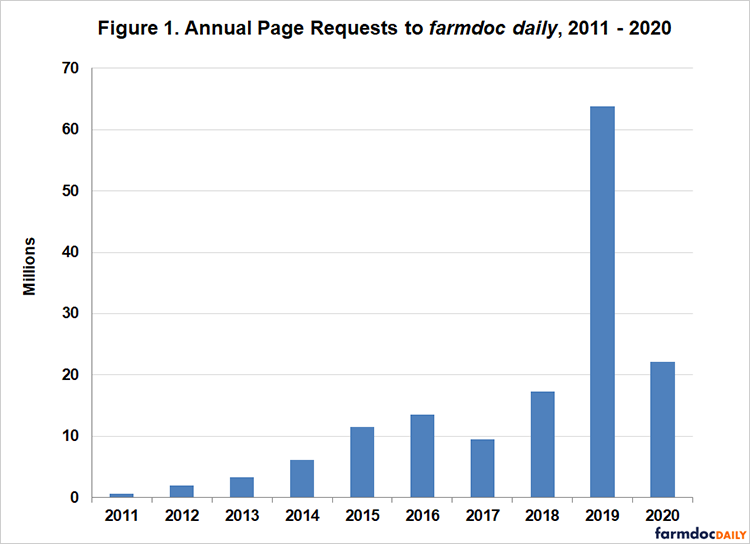
Figure 1 presents the history of annual page requests to farmdoc daily over 2011 through 2020. The level of page requests started out back in 2011 at a little over 600,000 and grew to a peak of just under 64 million in 2019. The tremendous surge in requests for 2019 was driven by the exceptionally wet spring and all of the issues surrounding late planting. The number of page requests returned to normal trendline growth in 2020 and totaled around 22,000,000. For the entire last decade, there was a total of 150 million page requests to farmdoc daily.
Figure 2 presents the history of annual unique visits to the farmdoc daily site over 2011 through 2020. The number of annual visits grew rapidly from 2011 through 2017, peaking at 2.2 million. Thereafter, the number of visits leveled off and averaged about 2.1 million per year. A total of 15.6 million visits have taken place over the last 10 years. To put that number in perspective, it equates to about 4,300 visits per day or 1800 visits per hour round-the-clock 24/7.
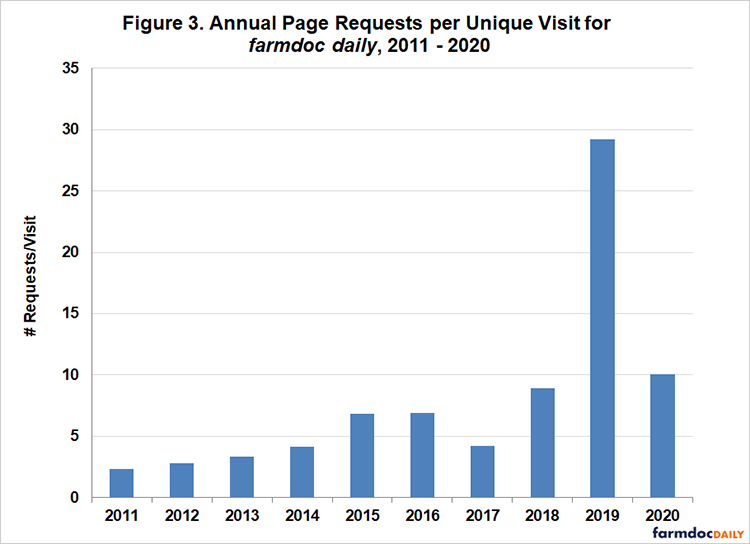
Figure 3 presents a measure of the intensity of usage for farmdoc daily over the last decade. It shows the number of page requests per unique visit on an annual basis. This ratio started at around two in 2011 and then grew steadily to about nine in 2018. Reflecting the surge in page requests in 2019, this ratio reached almost 30 in 2019. Clearly, visitors to farmdoc daily in 2019 were using the site in a very intensive manner. It is interesting to note that the ratio declined in 2020 but not all the way back to the level of 2018.
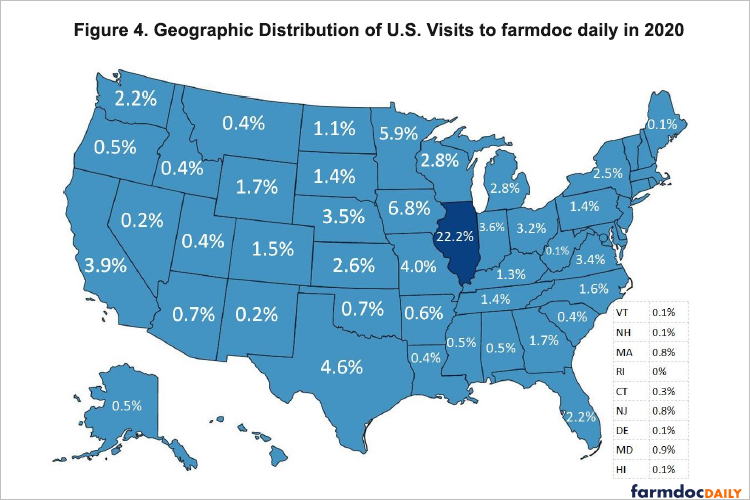
Figure 4 provides information on the geographic distribution of unique visits to farmdoc daily from within the U.S. during 2020. For perspective, about 80 percent of visits in 2020 were domestic and 20 percent were international. The international visits came from almost every country in the world. It is not surprising that the largest proportion of domestic visitors, 22.2 percent, came from Illinois. In total, about 60 percent of visits in 2020 came from Corn Belt states, which is important evidence that we are successful in reaching our target audience.
To provide an idea of the most popular subjects for visitors to farmdoc daily, Table 1 presents the top 20 all-time most requested articles over 2011-2020. The most popular articles tend to focus on management and policy, both key to agricultural decision-makers. We also see a strong representation of articles surrounding late planting issues in 2019 and policy responses to the COVID pandemic in 2020.
| Table 1. All-Time Top Twenty Most Requested Articles on farmdoc daily, 2011-2020 | |||
| Rank | Title | Date | Authors |
| 1 | Corn and Soybean Budgets for 2018 and 2019: Low Returns Ahead | 8/7/2018 | Gary Schnitkey |
| 2 | Prevented Planting Decision for Corn in the Midwest | 5/14/2019 | Gary Schnitkey, Krista Swanson, Ryan Batts, Carl Zulauf |
| 3 | Fertilizer Prices Higher for 2019 Crop | 9/25/2018 | Gary Schnitkey |
| 4 | Prevented Planting, 2019 Market Facilitation Program Payments, Disaster Assistance, and Price Dynamics | 5/29/2019 | Gary Schnitkey, Krista Swanson, Ryan Batts, Jonathan Coppess, Carl Zulauf |
| 5 | Machinery Cost Estimates for 2019 | 8/6/2019 | Dale Lattz, Gary Schnitkey |
| 6 | Introducing the Gardner-farmdoc Payment Calculator | 8/20/2019 | Jonathan Coppess, Gary Schnitkey, Nick Paulson, Carl Zulauf |
| 7 | 2017 Crop Budgets, 2016 Crop Returns and 2016 Incomes | 9/27/2016 | Gary Schnitkey |
| 8 | 2019 Illinois County and State Cash Rents | 9/27/2019 | Gary Schnitkey |
| 9 | The 2019 Market Facilitation Program | 7/30/2019 | Gary Schnitkey, Nick Paulson, Krista Swanson, Jonathan Coppess, Carl Zulauf |
| 10 | Projected 2015 Net Income on a 1,500 Acre Grain Farm | 7/14/2015 | Gary Schnitkey |
| 11 | Information for Making 2019 Cash Rental Decisions | 10/9/2018 | Gary Schnitkey |
| 12 | Late Planting Decisions in 2019 | 5/7/2019 | Gary Schnitkey, Carl Zulauf |
| 13 | Choosing Between ARC-CO and PLC | 10/1/2019 | Gary Schnitkey, Jonathan Coppess, Krista Swanson, Nick Paulson, Carl Zulauf |
| 14 | Historic Fertilizer, Seed, and Chemical Costs with 2019 Projections | 6/5/2018 | Gary Schnitkey |
| 15 | International Benchmarks for Wheat Production | 7/6/2018 | Rachel Purdy, Michael Langemeier |
| 16 | ARC-IC in 2019: Release of a 2019 ARC-IC Payment Calculator | 1/7/2020 | Gary Schnitkey, Krista Swanson, Ryan Batts, Jonathan Coppess, Nick Paulson, Carl Zulauf |
| 17 | Cash Rents on Professionally Managed Farmland in 2018 and 2019 | 3/27/2018 | Gary Schnitkey, Bruce Sherrick |
| 18 | Projected Corn and Soybean Breakeven Prices | 4/13/2018 | Michael Langemeier |
| 19 | Expected Harvest Prices for Corn in 2020 | 6/16/2020 | Gary Schnitkey, Krista Swanson, Nick Paulson, Jonathan Coppess, Carl Zulauf |
| 20 | WHIP+: Farm Aid for Losses Due to Natural Disasters | 4/21/2020 | Krista Swanson, Gary Schnitkey, Nick Paulson, Jonathan Coppess, Ben Brown, Carl Zulauf |
Thank You!
The entire farmdoc team thanks everyone that has visited and used the farmdoc daily site during the last 10 years. We truly appreciate our readers first and foremost. Your many questions, comments, and suggestions for improvement have been invaluable. Thank you for joining us on this journey!
Disclaimer: We request all readers, electronic media and others follow our citation guidelines when re-posting articles from farmdoc daily. Guidelines are available here. The farmdoc daily website falls under University of Illinois copyright and intellectual property rights. For a detailed statement, please see the University of Illinois Copyright Information and Policies here.


