


How Did Corn Farmers Adjust Nitrogen Application Rates in Illinois in 2022?
Note: This article was written by University of Illinois Agricultural and Consumer Economics Ph.D. student Menglin Liu and edited by Joe Janzen. It is one of several excellent articles written by graduate students in Prof. Janzen’s ACE 527 class in advanced agricultural price analysis this fall.
Fertilizer prices for the 2022 crop season were much higher than previous years (Schnitkey et al., 2021; Schnitkey, Paulson, et al., 2022; Schnitkey, Swanson, et al., 2022). We consider how Illinois farmers may have responded to these higher prices, focusing on nitrogen fertilizer use since nitrogen saw the largest price increases in 2022. While there is no consistent comprehensive data on nitrogen use at the state level, we attempt to infer nitrogen application rates for corn in Illinois in 2022 based on what we do know about fertilizer costs, prices, and other variables. Our analysis suggests nitrogen application rates at the state level likely declined slightly in 2022 compared to 2021 in response to higher prices. Use of other fertilizers likely declined more as farmers sought to maintain corn production in the face of very high corn prics. Understanding actual farmer fertilizer use behavior in response to price changes is important two reasons: i) farm profitability, which depends on the economically efficient use of costly inputs, and ii) environmental outcomes such as water quality and greenhouse gas emissions linked to aggregate nitrogen fertilizer use.
What Do We Know About Illinois Crop Production and Fertilizer Use in 2022?
Fertilizer use, a major component of crop production costs in Illinois, depends on market prices, crop choices, and other factors. Fertilizer prices were extraordinarily high in 2022. Figure 1 plots bi-weekly unit prices per pound of nitrogen (N), phosphate (P2O5), and potash (K2O) in Illinois from 2017 to 2023. These prices adjust the prices of commercial fertilizers to account for differences in nutrient composition among products. Unit prices for nitrogen differ across the three available forms: anhydrous ammonia, urea, and liquid nitrogen. On a nutrient unit basis, anhydrous ammonia is cheaper than urea and liquid nitrogen. Urea and liquid nitrogen prices were very similar until the price spike in early 2022, but liquid nitrogen price exceeded the urea price thereafter. Before mid-2021, phosphate prices for MAP and DAP fertilizers followed similar trends.
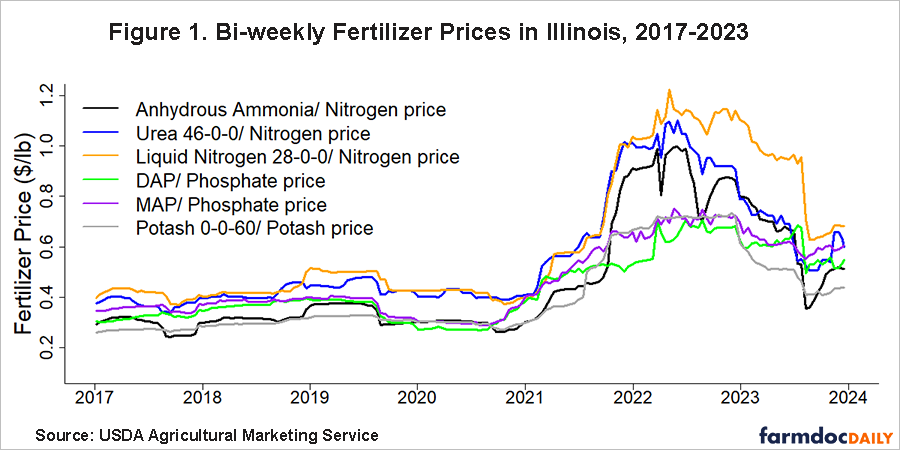
Nitrogen, phosphate, and potash prices all increased starting in early 2021, but the magnitude of the increase in nitrogen prices was larger. The anhydrous ammonia price rose from around $0.30 per pound to $1.00 per pound at the peak in June 2022. Both phosphate and potash prices climbed from about $0.30 per pound to above $0.70 per pound.
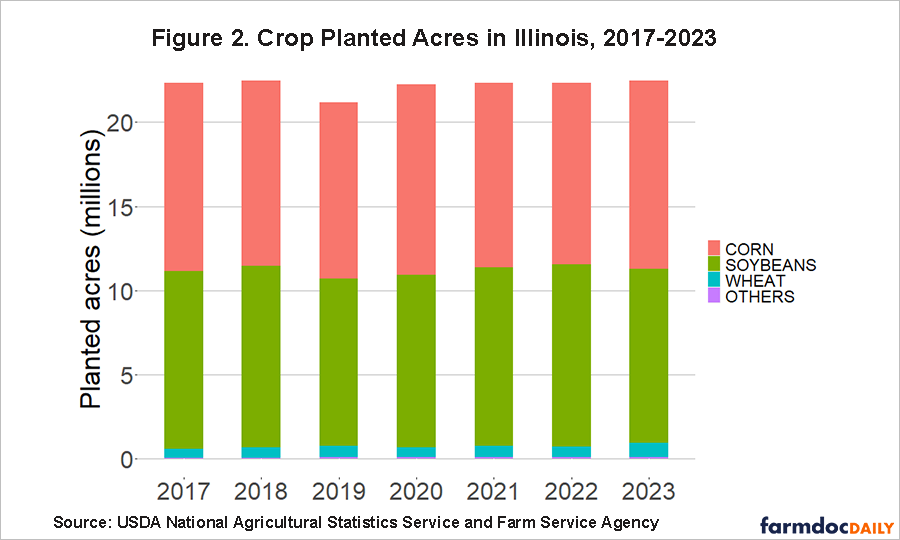
Crop choice changed only slightly in 2022 relative to previous years. Figure 2 shows the composition of planted crop acreage in Illinois from 2017 to 2023. Three crops – corn, soybeans, and wheat – account for more than 99% of total planted crop acres. Crop choice matters because different crops have different fertilizer needs: corn needs substantially more nitrogen than other crops, especially nitrogen-fixing plants like soybeans. Total acres in 2022 were similar to other years at about 22 million acres. The composition of acreage in 2022 changed slightly: corn and wheat acres decreased 1.8% and 3% compared to 2021, respectively. Soybean acreage increased about 1.9% in 2022 compared to the year prior. As fertilizer prices fell in 2023, farmers shifted acres back to corn with state corn acres increasing 3.7% compared to 2022.
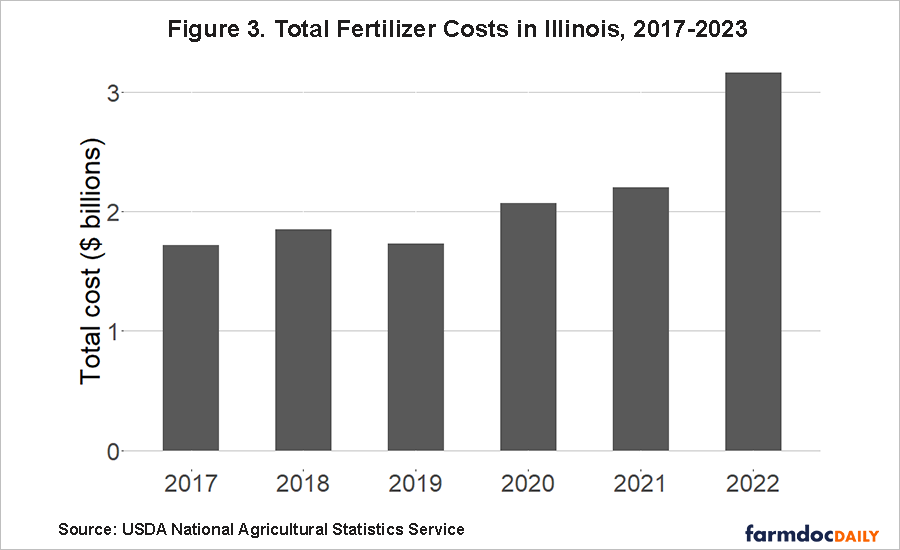
The National Agricultural Statistics Service (NASS) publishes annual state-level estimates of total fertilizer costs; this estimate includes the cost of nitrogen, phosphate, potash, plus other fertilizers and soil amendments such as lime. Total fertilizer costs for Illinois are shown in Figure 3. Costs in 2022 increased 70.8% compared to 2018. While the time pattern of total costs and price levels is similar, the magnitude of the cost increase is smaller. With only small shifts in the composition of planted acres, this suggests some adjustment in fertilizer application rates.
Inferring 2022 Nitrogen Application Rates
Our main objective is to estimate the state-level nitrogen application rate for corn in Illinois in 2022. NASS publishes data on fertilizer application rates from its Chemical Use survey. However, the agency does not conduct a Chemical Use survey for all crops every year. Instead, it surveys producers of specific crops on a rotating basis. Illinois fertilizer use data are available for corn in 2016, 2018, and 2021, for soybeans in 2017, 2018, and 2020, and for wheat in 2017, 2019, and 2022.
Without farm survey data, we attempt to infer what nitrogen application rates were in 2022 based on what we do know about total costs, prices, and acreage. We rely on the following basic formula for the total nutrient-specific (nitrogen, phosphate, or potash) fertilizer cost:
Prices and planted acres are observed. Estimating the nitrogen application rate for corn requires a set of assumptions about other fertilizer use choices made by farmers, specifically application rates of phosphate, potash and other fertilizers and the share of acres fertilized. While nearly all (98-99%) of corn acres in Illinois receive nitrogen applications, the share of acres fertilized does vary some for other crops and nutrients.
We proceed in three steps:
- Estimate total fertilizer costs for corn acres by subtracting fertilizer costs for soybeans and wheat, as well as all other costs from the 2022 total cost given in Figure 3 above.
- Back out nitrogen fertilizer costs for corn by subtracting approximations of non-nitrogen (phosphate and potash) costs for corn based on observed prices and assumed application rates for non-nitrogen fertilizers.
- Infer the nitrogen application rate for corn by solving for the unknown application rate in the above formula for the total nitrogen cost for corn.
This process requires the set of assumptions summarized as follows. In all steps, fertilizer prices for 2022 are the means of the prices between May 1st 2021 and May 1st 2022. The anhydrous ammonia price is used for nitrogen and the DAP price is used for phosphate. Planted acres are given in NASS data.
- For Step 1:
- Soybean costs are based on observed 2022 prices and acres. Soybean fertilizer application rates and share fertilized are assumed to be the same in 2022 as in 2020. This year had slightly lower soybean fertilizer application rates and slightly higher share of acres fertilized relative to long-run average levels.
- Wheat fertilizer use for 2022 is observed in NASS survey data.
- Other costs for 2022 are the same as other costs in 2018, adjusted for inflation using the US CPI. 2018 is the baseline because we have relatively complete information about corn and soybean fertilizer use in that year.
- For Steps 2 and 3:
- Corn phosphate and potash application rates and the share of acres fertilized for all nutrient types are assumed to follow one of four scenarios.
- Scenario 1 (High phosphate and potash use): Same values as in 2021.
- Scenario 2 (Medium phosphate and potash use): Average values for the past three available years (2016, 2018, 2021)
- Scenario 3 (Low phosphate and potash use): Average of available years in the past 31 years (1990 – 2021)
- Scenario 4 (Very low phosphate and potash use): Lowest among the three most recent years (2016, 2018 and 2021)
- Data on rates and acreage shares for each Scenario are given in Table A1 after the conclusion of this article.
- Corn phosphate and potash application rates and the share of acres fertilized for all nutrient types are assumed to follow one of four scenarios.
Results
Inferred nitrogen fertilizer application rates for corn in Illinois in 2022 under each scenario are shown in Figure 4, along with observed and assumed application rates for soybeans and wheat from 2017 to 2022. Not every year has observed, assumed, or inferred values. The solid lines connect observed values, and the dashed lines direct to the inferred values (for corn) or assumed value (for soybeans). Labelled dots for application rates for corn in 2022 represent inferred values for the four scenarios defined above.
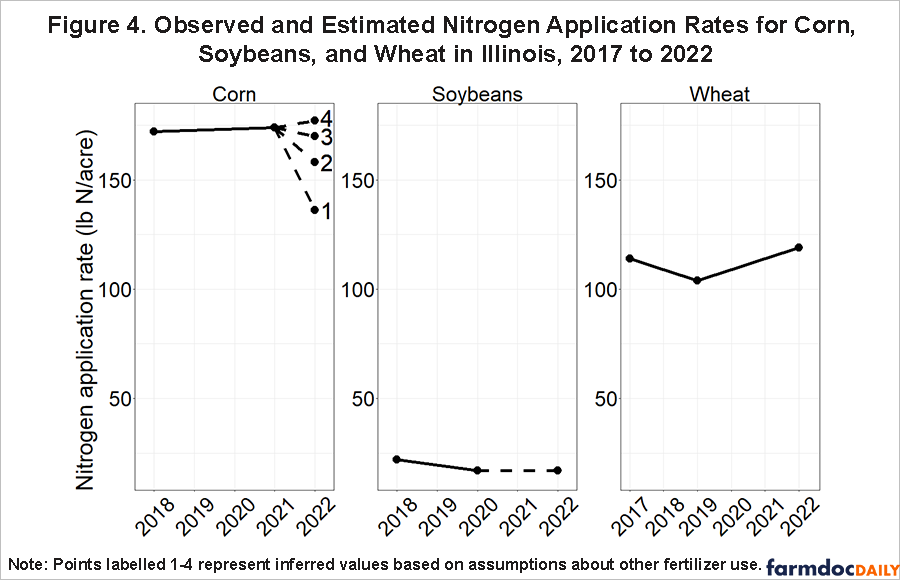
We find inferred nitrogen application rates of 136 to 177 lb N per acre depending on the scenario considered for other fertilizer use. We view the results from scenarios 2 and 3 as the most likely outcomes. The extreme values in Scenarios 1 and 4 are unlikely. In Scenario 1 with high phosphate and potash use, the resulting nitrogen application rate of 136 lb N per acre is lower than any rate reported between 1990 and 2021. It is so much lower than previous years that it would likely result in lower corn yields (which were not observed in 2022 when Illinois set a state corn yield record). Moreover, it seems implausible that farmers cut back exclusively on nitrogen for corn while maintaining high phosphate and potash applications. In Scenario 4 with very low phosphate and potash use, nitrogen fertilizer application rates increase in the face of rising prices. This outcome seems similarly implausible.
The nitrogen application rate obtained based on scenario 2 is 158 lb N/acre. This scenario assumes that the phosphate and potash use is at a medium level and nearly all corn acres (98%) receive nitrogen. Compared to 2021, phosphate and potash application rates are assumed to increase slightly. However, the shares of corn acreage receiving phosphate and potash drop to 87% and 81%, respectively. This suggests that decreasing the share of acres fertilized may be as or more important than decreasing the application rate per acre to lower overall fertilizer costs. While the medium phosphate and potash use in scenario 2 is more plausible, the nitrogen application rate inferred here is still lower than any rate reported in the past 11 years. We view the assumption that farmers did not cut phosphate and potash rates but did reduce the share of acres as less plausible than our scenario 3.
Under scenario 3, farmers reduced nitrogen application rates only slightly between 2021 and 2022, from 174 to 170 lb N per acre. In this scenario, farmers also lower phosphate application rates and the share of crop acres receiving phosphate and potash to reduce overall fertilizer costs. Both application rates and share of acres fertilized for phosphate are assumed lower than any values reported in the three most recent years. The application rate and share of acres fertilized for potash are low but within the range of those in the three most recent reported years. We view this as more likely because nutrients remaining in the soil from prior years may have been sufficient to provide what is necessary for corn growth. Thus, lowering the phosphate and potash application rates for one year may not have much impact on the yield. This allowed nitrogen application rates and the share of corn acres received nitrogen to remain at relatively high levels perceived to be required for successful corn production.
Conclusion
We estimate that in 2022, Illinois farmers responded to high fertilizer prices with some combination of lower fertilizer application rates and lower shares of crop acres receiving fertilizer. Changing application rates is not the only way farms can respond to changing input costs. We note that Illinois farms also adjusted slightly the allocation of the land to plant corn, soybeans, and wheat in response to the high fertilizer prices. This change was also part of the overall change in production and production costs in 2022.
Our analysis suggests the most likely scenario involved decreases in phosphorus and potash use and acreage. These larger decreases in phosphate and potash use permitted only slight declines in nitrogen application rates and the same proportion of corn acres receiving nitrogen. This allowed Illinois farms to produce a record state-wide corn yield and take advantage of historically high corn price levels. We also find that in the short-run, farmers may have reduced the share of acres receiving phosphate and potash applications more than reducing the phosphate and potash application rates to reduce costs. However, we note our results are based on assumptions and inference; to fully understand farmers response to the 2022 fertilizer price shock, direct observation of fertilizer use decisions is necessary.
References
Schnitkey, G., N. Paulson, C. Zulauf, K. Swanson and J. Baltz. "Nitrogen Fertilizer Prices Above Expected Levels." farmdoc daily (11):165, Department of Agricultural and Consumer Economics, University of Illinois at Urbana-Champaign, December 14, 2021.
Schnitkey, G., N. Paulson, C. Zulauf, K. Swanson, J. Colussi and J. Baltz. "Nitrogen Fertilizer Prices and Supply in Light of the Ukraine-Russia Conflict." farmdoc daily (12):45, Department of Agricultural and Consumer Economics, University of Illinois at Urbana-Champaign, April 5, 2022.
Schnitkey, G., K. Swanson, N. Paulson, C. Zulauf, J. Coppess and J. Baltz. "Nitrogen Fertilizer Outlook for 2023 Decisions." farmdoc daily (12):106, Department of Agricultural and Consumer Economics, University of Illinois at Urbana-Champaign, July 19, 2022.
Schnitkey, G., N. Paulson, C. Zulauf, K. Swanson and J. Baltz. "Nitrogen Fertilizer Prices Above Expected Levels." farmdoc daily (11):165, Department of Agricultural and Consumer Economics, University of Illinois at Urbana-Champaign, December 14, 2021.
Appendices
Table A1. Historical Data on Fertilizer Application Rates and Percentage of Crop Acreage Receiving Fertilizer by Crop and Year in Illinois
Source: USDA National Agricultural Statistics Service
| Fertilizer application rate (pounds per fertilized acre) | ||||
| Nitrogen | Phosphate | Potash | Year | |
| Corn | 174 | 85 | 104 | 2021 |
| 172 | 108 | 135 | 2018 | |
| 169 | 89 | 110 | 2016 | |
| 172 | 94 | 116 | Average | |
| 160 | 82 | 111 | Average of 1990 - 2021 | |
| Soybeans | 17 | 67 | 114 | 2020 |
| 22 | 75 | 111 | 2018 | |
| 24 | 73 | 127 | 2017 | |
| 21 | 72 | 117 | Average | |
| Wheat | 119 | 88 | 142 | 2022 |
| 104 | 73 | 111 | 2019 | |
| 114 | 81 | 115 | 2017 | |
| 112 | 81 | 123 | Average | |
| Percentage of crop acreage receiving fertilizers | ||||
| Nitrogen | Phosphate | Potash | Year | |
| Corn | 99 | 89 | 85 | 2021 |
| 98 | 87 | 77 | 2018 | |
| 98 | 86 | 81 | 2016 | |
| 98 | 87 | 81 | Average | |
| 98 | 84 | 82 | Average of 1990 - 2021 | |
| Soybeans | 31 | 35 | 52 | 2020 |
| 25 | 43 | 61 | 2018 | |
| 25 | 36 | 53 | 2017 | |
| 27 | 38 | 55 | Average | |
| Wheat | 94 | 70 | 80 | 2022 |
| 94 | 88 | 78 | 2019 | |
| 92 | 86 | 70 | 2017 | |
| 93 | 81 | 76 | Average | |
Disclaimer: We request all readers, electronic media and others follow our citation guidelines when re-posting articles from farmdoc daily. Guidelines are available here. The farmdoc daily website falls under University of Illinois copyright and intellectual property rights. For a detailed statement, please see the University of Illinois Copyright Information and Policies here.