








Conservation & Risk, Part 5: Examining a Risk-Payment Gap for Nitrogen Management
Agricultural conservation policies include assistance for nutrient management. To the extent that this assistance is intended to encourage farmers to reduce application rates for nutrients, such as nitrogen, the policy presents another variation on the conservation-risk challenges examined in this series. While reducing application rates lowers what a farmer spends on nitrogen, doing so may expose them to lower yields in some years. Part 4 in this series examined corn yield responses to different nitrogen application rates under varying historical weather conditions (farmdoc daily, September 10, 2026). This article extends that analysis by examining a case study to illustrate the potential costs and risks from reduced nitrogen application alongside the financial assistance available through the Environmental Quality Incentive Program (EQIP) for Nutrient Management (Practice 590).
Background
The Environmental Quality Incentives Program (EQIP) is the primary source of financial assistance for farmers implementing nutrient management practices and generally provides assistance based on estimated implementation costs, up to 75% under the standard payment rate. Federal policy also recognizes that conservation practices can create broader economic losses for producers; for conservation incentive contracts, Congress expanded income-foregone authority to include increased economic risk and revenue lost due to anticipated yield reductions (farmdoc daily, May 7, 2026). From 2014 to 2023, EQIP provided over $170 million in financial assistance for nutrient management, representing just under 1.7% of total EQIP financial assistance. Ohio, North Dakota, Indiana, Michigan, and Minnesota received the most nutrient management assistance over that period (Policy Design Lab, EQIP).
Practice 590 provides a particularly direct example of the risk-payment issue because reducing nitrogen application can lower input costs while also affecting an input central to crop yield and farm revenue. Note that Practice 590 includes multiple scenarios that are not directly comparable for this analysis because they may involve different nutrient sources, technologies, testing requirements, and application methods. We therefore use the most recent comparable NRCS scenario, the 2025 Nutrient Management – Non-Organic scenario (#370), which most closely aligns with the modeled reduction in synthetic nitrogen application.
Discussion
We build this discussion of risk for reducing nitrogen application rates in corn fields from the same example field used in Part 4 of this series: a 100-acre field in McLean County, Illinois, evaluated using 15 years of historical weather conditions from 1990 to 2018 (every other year to represent a corn/soybean rotation). As before, we use modeled simulations of corn yields under the different weather conditions to estimate yield responses to different nitrogen application rates, while holding other management practices constant so that differences across years reflect weather and weather-induced soil conditions. The model’s yield estimates are from simulated data validated against field trials, reported at the subfield level and aggregated to the field level.
We specifically used an application rate reduction from 200 to 171 pounds of nitrogen per acre, which is the profit-maximizing rate from the Maximum Return to Nitrogen (MRTN) calculator for central Illinois, based on an anhydrous ammonia price of $0.645 per pound of nitrogen and a corn price of $4.56 per bushel (Corn Nitrogen Rate Calculator, 2026; USDA-AMS, 2026; USDA-NASS, 2026). Table 1 summarizes the primary economic components of the case study and illustrates the potential for yield and revenue loss under certain circumstances (Liu, 2026; Mandrini et al., 2022).
| Table 1. Illustrative Producer Effects from Reduced Nitrogen Application | ||||||
| (1) Modeled N Reduction (lb N/ac) | (2) Fertilizer Savings from N Reduction ($/ac) | (3) EQIP: Estimated Uncovered 590 Costs ($/ac) | (4) Modeled Yield Impact (bu/ac) | (5) Estimated Revenue Impact ($/ac) | (6) Net Producer Effect ($/ac) | (7) Simulated Years with This Yield Impact (out of 15) |
| 29 | $18.71 | -$7.80 | 0 | $0.00 | $10.91 | 12 |
| -0.6 | -$2.74 | $8.17 | 1 | |||
| -0.9 | -$4.10 | $6.81 | 1 | |||
| -10.8 | -$49.25 | -$38.34 | 1 | |||
In the simplest terms, lower nitrogen application rates reduce the farmer’s fertilizer costs (farmdoc daily, September 29, 2026; August 11, 2026). Columns 1 and 2 of Table 1 show this effect. The cost reduction is based on application rates reduced by 29 lbs-N/acre, resulting in $18.71/acre in fertilizer savings based on an anhydrous ammonia price of $0.645/lb on June 26, 2026 (USDA-AMS).
Column 3 represents the portion of the estimated Practice 590 implementation cost not covered by EQIP financial assistance. Note that NRCS estimated an implementation cost for this practice of $31.19 per acre in 2025 for the Nutrient Management – Non-Organic scenario (#370) under Practice 590 (USDA-NRCS, “Nutrient Management (Ac.) (590) Conservation Practice Standard”). NRCS generally estimates the costs for the practice to include labor costs and application equipment costs primarily; previously, NRCS also included costs of soil testing in the overall estimate (USDA-NRCS, “Payment Schedules” and “Field Office Technical Guides” (FOTG)). If reimbursed at the standard rate of 75% ($23.39), the farmer would be left with paying for $7.80 of the estimated implementation cost.
Columns 4 through 7 show how modeled yield losses under different weather conditions translate into revenue losses, net producer effects, and the number of simulated years in which each yield outcome occurred. Under some weather and soil conditions, lower nitrogen rates may also reduce yields, and those lost bushels could easily cost the farmer more than paying for additional nitrogen. The agronomic and economic consequences of reducing nitrogen are uncertain because weather and soil conditions have an enormous effect on the crop’s response to applied nitrogen. As one example, the economically optimal application rate can vary across years and locations (farmdoc daily, September 10, 2026; Babcock, 1992; Morris et al., 2018; Sawyer et al., 2006).
The model simulations align with this understanding, estimating any impact on corn yield from reducing nitrogen application rates as depending primarily on the conditions in a given year and field, especially weather, rather than on the nitrogen rate alone. In this single field case study, 12 out of the 15 years simulated in the model would not have experienced a yield loss from reducing the nitrogen application rate by 29 pounds per acre. Additionally, in two of the simulated years, the yield loss is low (less than one bushel per acre) with little impact on the farmer’s revenue.
The one year in which the model returned an impactful yield reduction with reduced N application rate was based on the weather in 1996. The model estimated 10.8 bushels/acre lower yields from the combination of 1996 weather and the reduced rate of 171 lbs-N/acre (instead of 200). To understand this better requires a deeper dive into the model, the Agricultural Production Systems sIMulator (APSIM) model (Holzworth et al., 2014; Mandrini et al., 2022). The APSIM model uses weather information including total precipitation, average solar radiation, and average temperature to simulate yield outcomes. Figure 1 shows how 1996 weather conditions during key crop growth stages compare with the average across all fifteen simulated years.
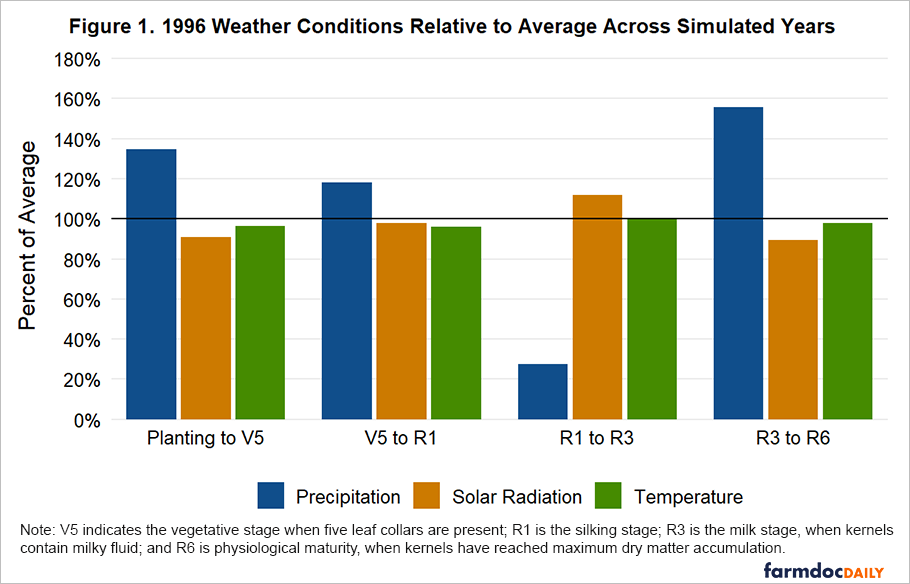
For additional context, NASS reported a McLean County average corn yield of 159 bushels per acre in 1996, compared with an average of 133.1 bushels per acre over the previous 10 years. This suggests that 1996 was a relatively favorable production year overall. However, weather conditions varied considerably within the growing season. As shown in Figure 1, precipitation was well above the average across simulated years from planting through V5, the early vegetative stage when five leaf collars are present. It remained above average through R1, when silking begins. Precipitation then fell sharply below average from R1 to R3, the period from silking to the milk stage of kernel development. Solar radiation during that same period was above average, while temperatures remained relatively close to average. In the model, this combination and timing of weather conditions was associated with the largest yield difference between the 200- and 171-pound nitrogen rates, with the reduced rate producing 10.8 fewer bushels per acre.
While further analysis is needed to understand why this combination of weather conditions produced such a large modeled yield response, the economic consequence is clear. At a corn price of $4.56 per bushel, the 10.8-bushel-per-acre yield loss represents approximately $49.25 per acre in lost revenue. After accounting for $18.71 per acre in fertilizer savings and $7.80 per acre in uncovered implementation costs, the net producer effect is a loss of $38.34 per acre. This result describes the severity of the modeled loss when it occurs; it does not estimate the probability of experiencing such a loss. Future studies and articles will incorporate both severity and probability to better quantify yield risk and inform policy design that responds to the potential for yield loss when nitrogen application is reduced.
Concluding Thoughts
Nitrogen management—or, more precisely, reducing nitrogen application rates—sits at the intersection of farm profitability, production risk, and environmental performance. The same nitrogen reduction can have very different economic consequences depending on weather, soil conditions, crop response, fertilizer prices, and corn prices. Those uncertainties are the reasons for the research discussed in this series (farmdoc daily, May 28, 2026; May 21, 2026; May 7, 2026; September 10, 2026). For the nitrogen question, the focus has been on the yield-response risk rather than a single recommended application rate. The farmer’s exposure depends on the balance among fertilizer-cost savings, any implementation costs not covered by EQIP, and the potential lost revenue from lower crop yields in the year.
Placing the EQIP reimbursement alongside the modeled yield response makes the economic tradeoff more visible. For an illustrative acre, we define the net producer effect as fertilizer-cost savings from applying less nitrogen, less the uncovered portion of the Practice 590 implementation cost and any modeled yield-related revenue loss. This is a comparative accounting exercise rather than a farm-level profit estimate. It is intended to show how the economic consequences of reducing nitrogen can vary with weather and yield response. EQIP offsets part of the estimated implementation cost, reduced nitrogen lowers fertilizer expense, and the remaining uncertainty comes from how yield responds under specific weather and soil conditions. In this case study of a single field in McLean County, Illinois, the model simulations of that field suggest a range of -$38.34/acre and $10.91/acre in net producer effect because of N reduction under weather conditions for every other year from 1990 to 2018. Together, these components provide a more complete picture of the economic risks facing producers who reduce nitrogen application.
In most cases, the producer experiences net gains, but once a loss occurs, the amount can be much larger than the gains. This raises an important consideration for conservation assistance: how to address the possibility of substantial losses to the farmer even when reducing nitrogen provides an economic benefit under most outcomes. Risk-responsive assistance could help address concern about large potential losses that may discourage farmers from reducing nitrogen application rates. Within the conservation risk framework developed in this series, addressing that concern begins with understanding which weather conditions make losses more likely to exceed fertilizer savings. Examining weather conditions at different crop growth stages could help identify potential risk triggers that seasonal averages may overlook. Even a generally favorable growing season may include periods when precipitation or temperature affects nitrogen availability or crop uptake during stages of high nitrogen demand, potentially increasing the risk of yield loss when nitrogen application is reduced. The weather comparisons offer a starting point, while additional analysis of soil and crop responses would help explain what drives those losses. Connecting these conditions to producer exposure could help evaluate whether supplemental assistance tied to identifiable risks would better address the risk-payment gap.
The goal is not to identify a single payment rate that eliminates all producer risk. Rather, the analysis shows that implementation-cost assistance addresses only one part of the economic decision. If conservation policy is intended to support durable changes in nutrient management, the potential for yield-related revenue loss also matters alongside the direct cost of implementing the practice.
References
Babcock, B. A. “The Effects of Uncertainty on Optimal Nitrogen Applications.” Applied Economic Perspectives and Policy 14(2) (1992): 271-280.
Corn Nitrogen Rate Calculator. “Corn Nitrogen Rate Calculator.” 2026. https://www.cornnratecalc.org/calculator.
Coppess, J., E. J. Diaz-Vallejo, Y. Qin and K. Guan. “Conservation & Risk, Part 2: Examining the Spring Planting Window in Illinois.” farmdoc daily (16):89, Department of Agricultural and Consumer Economics, University of Illinois at Urbana-Champaign, May 21, 2026.
Coppess, J., K. Guan and E. J. Diaz-Vallejo. “Conservation & Risk, Part 1: Introduction and Hypothesis.” farmdoc daily (16):76, Department of Agricultural and Consumer Economics, University of Illinois at Urbana-Champaign, May 7, 2026.
Coppess, J., M. Liu, E. J. Diaz-Vallejo and N. Loduca. “Conservation & Risk, Part 4: Approaching the Nitrogen Application Question.” farmdoc daily (16):162, Department of Agricultural and Consumer Economics, University of Illinois at Urbana-Champaign, September 10, 2026.
Holzworth, D.P., Huth, N.I., deVoil, P.G., Zurcher, E.J., Herrmann, N.I., McLean, G., Chenu, K., van Oosterom, E.J., Snow, V., Murphy, C. and Moore, A.D., 2014. APSIM–evolution towards a new generation of agricultural systems simulation. Environmental Modelling & Software, 62, pp.327-350. https://doi.org/10.1016/j.envsoft.2014.07.009.
Liu, M. “Three Essays on the Adoption of Sustainable Agricultural Production Practices.” Ph.D. Dissertation, University of Illinois Urbana-Champaign, 2026.
Loduca, N., J. Coppess, E. J. Diaz-Vallejo, Y. Qin and K. Guan. “Conservation & Risk, Part 3: Exploring the Risk-Payment Gap.” farmdoc daily (16):93, Department of Agricultural and Consumer Economics, University of Illinois at Urbana-Champaign, May 28, 2026.
Mandrini, G., E. A. Davidson, E. D. Nafziger, A. J. Eagle, C. M. Pittelkow, L. F. Gentry, G. D. Schnitkey et al. “A market-based insurance approach aligns environmental and economic outcomes in maize nitrogen management.” Communications Earth & Environment (2025).
Morris, T. F., T. S. Murrell, D. B. Beegle, J. J. Camberato, R. B. Ferguson, J. Grove, Q. Ketterings et al. “Strengths and Limitations of Nitrogen Rate Recommendations for Corn and Opportunities for Improvement.” Agronomy Journal 110 (2018): 1-37.
Sawyer, J., E. Nafziger, G. Randall, L. Bundy, G. Rehm and B. Joern. “Concepts and rationale for regional nitrogen rate guidelines for corn.” Iowa State University Extension, 2006.
U.S. Department of Agriculture, Agricultural Marketing Service (USDA-AMS). Illinois Production Cost Report. June 26, 2026.
U.S. Department of Agriculture, National Agricultural Statistics Service (USDA-NASS). Agricultural Prices. May 2026.
U.S. Department of Agriculture, Natural Resources Conservation Service (USDA-NRCS). Illinois EQIP contract data and Illinois payment schedule data for Practice 590, Nutrient Management, FY2017-FY2026. Data provided to the University of Illinois through a USDA NRCS cooperative agreement.
U.S. Department of Agriculture, Natural Resources Conservation Service (USDA-NRCS). “Fiscal Year 2026, Practice Code 590 - Nutrient Management, Scenario 370: Nutrient Management.” Practice scenario documentation, 2026.
Disclaimer: We request all readers, electronic media and others follow our citation guidelines when re-posting articles from farmdoc daily. Guidelines are available here. The farmdoc daily website falls under University of Illinois copyright and intellectual property rights. For a detailed statement, please see the University of Illinois Copyright Information and Policies here.