








Sample Cost and Returns for a Migratory Commercial Beekeeping Operation 2025-2026
Honey bees play a critical role in agricultural production, particularly through pollination services that support crops such as California almonds (see farmdoc daily, February 17, 2025), while also producing honey and other hive products. However, commercial beekeepers face substantial costs and uncertainty associated with labor, transportation, colony health, and replacing colonies lost throughout the year. Unlike many other agricultural commodities (for example, see farmdoc daily, September 1, 2026), commercial beekeeping has lacked detailed enterprise budgets assess industry profitability and the economic impacts of colony health challenges. The recently published Sample Cost and Returns for a Migratory Commercial Beekeeping Operation 2025–2026 addresses this gap. This farmdoc daily article summarizes its key findings.
Our results reveal narrow profit margins for commercial beekeeping. For a representative migratory operation managing 8,500 colonies in 2025–2026, estimated returns above cash costs are approximately $31 per colony. However, without payments from USDA’s Emergency Assistance for Livestock, Honey Bees, and Farm-Raised Fish Program (ELAP), returns above cash costs would be negative. When accounting for capital recovery costs, the cost of replacing and maintaining equipment and infrastructure in the long-term, the operation incurs a loss of $62 per colony. Thus, while government assistance helps cover short-term cash expenses, current returns may be insufficient to support long-term reinvestment and sustain the operation.
The full publication can be found in the Management section of the farmdoc website.
Overview of Representative Operation
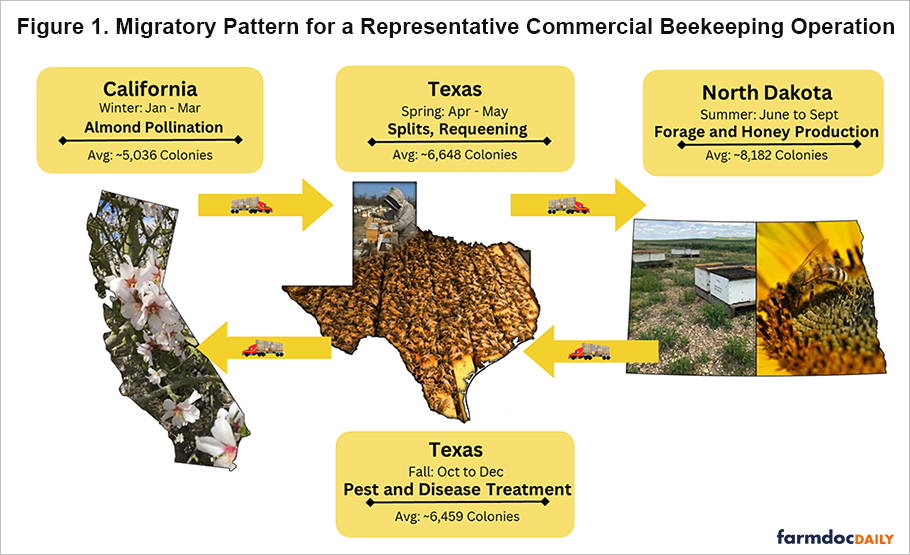
We provide costs and returns for a sample 8,500-colony commercial migratory beekeeping operation. The representative operation is headquartered in North Dakota for summer honey production and utilizes holding yards in Texas for colony management, while transporting colonies to California in late winter for almond pollination. The assumptions used in this study reflect typical conditions for large-scale beekeeping operations in these states rather than representing any single operation.
The operation follows a typical migratory management cycle across the three states which is depicted in Figure 1.
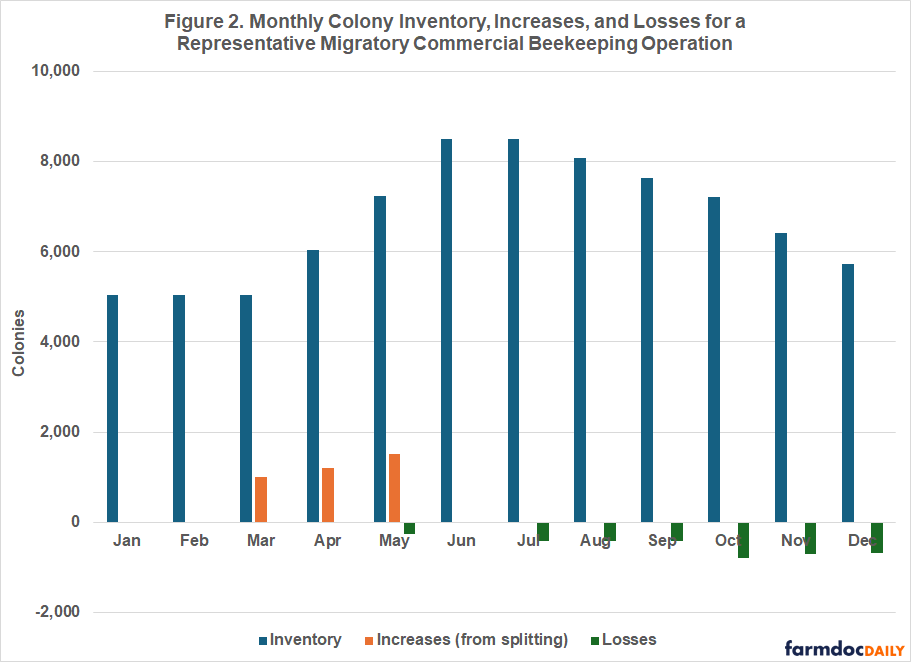
The size benchmark of 8,500 colonies represents the maximum number of strong, viable summer colonies maintained for honey extraction in North Dakota. Because overwinter losses are expected, beekeepers typically maintain more colonies in the summer and fall than they rent out for almond pollination. Figure 2 displays the monthly colony inventory for this operation throughout the year, as well as colony losses and increases from splitting. We have assumed this operation loses 44% of its maximum number of colonies throughout the year, with 18% occurring during the summer and 26% occurring during fall and winter months. These percentages are in line with numbers for commercial operations found by the US beekeeping survey in recent years.
Revenues
The primary revenues for this commercial beekeeping operation come from renting hives for almond pollination services in California and producing honey in North Dakota. We assume that the operation rents out 5,000 colonies for almond pollination at $195/colony, and that the operation produces an average of 70 pounds of honey per colony and honey can be sold at a bulk price of $1.90 per pound. Based on colony losses throughout the year, this operation qualifies for the Emergency Assistance for Livestock, Honey bee, and Farm-Raised Fish Program (ELAP) administered by USDA Farm Service Agency. ELAP payments for qualifying losses are included in the study as revenues.
Operating Costs
A detailed discussion of operating costs and management practices can be found in the study. Here we provide a summary of the major factors influencing operating costs for this commercial beekeeping operation:
- Supplemental food: An average of 9 gallons of sugar syrup and 5 pounds of protein patties are provided to colonies throughout the year
- Pest management: Multiple types of active ingredients (amitraz, oxalic acid, formic acid) are used at appropriate times throughout the year to manage Varroa mites
- Purchased bees: Queen cells are purchased for splits and requeening 95% of colonies. Colonies that do not establish a queen from a queen cell are requeened with purchased mated queen
- Labor: The operation employs a mix of full-time salaried and hourly H-2A workers
- Transportation: The operation owns trucks and forklifts for local hive hauling but contracts with commercial trucking companies for long-distance travel
Cash and Non-cash Overhead Costs
Cash overhead consists of various cash expenses paid out during the year that are assigned to the whole business. These costs include property taxes, liability and property insurance, equipment repairs, utilities, costs for renting holding yards in California, and overhead expenses associated with H-2A labor.
Non-cash overhead is calculated as the capital recovery cost for equipment and other apiary investments. Capital recovery cost is equivalent to the annual payment on a loan for the investment with the down payment equal to the discounted salvage value. An interest rate of 8.25 percent is used to calculate capital recovery cost.
2025-2026 Costs and Returns
Table 1 summarizes costs and returns for the representative operation. Operating costs account for 59% of total costs, while cash and non-cash overhead account for 14% and 27%, respectively. The operation generates approximately $31 per colony after covering annual cash costs but incurs a loss of approximately $62 per colony when capital recovery costs are included. Thus, the operation can cover its immediate cash expenses, but current returns may be insufficient to sustain long-term equipment and infrastructure replacement and maintenance. Notably, ELAP payments exceed net returns above cash costs, indicating that government assistance is necessary for the operation to cover its cash expenses. This financial situation mirrors that of other agricultural commodities, where government assistance has become important to farm financial viability (see farmdoc daily, January 7, 2025, December 2, 2025, and September 18, 2026).
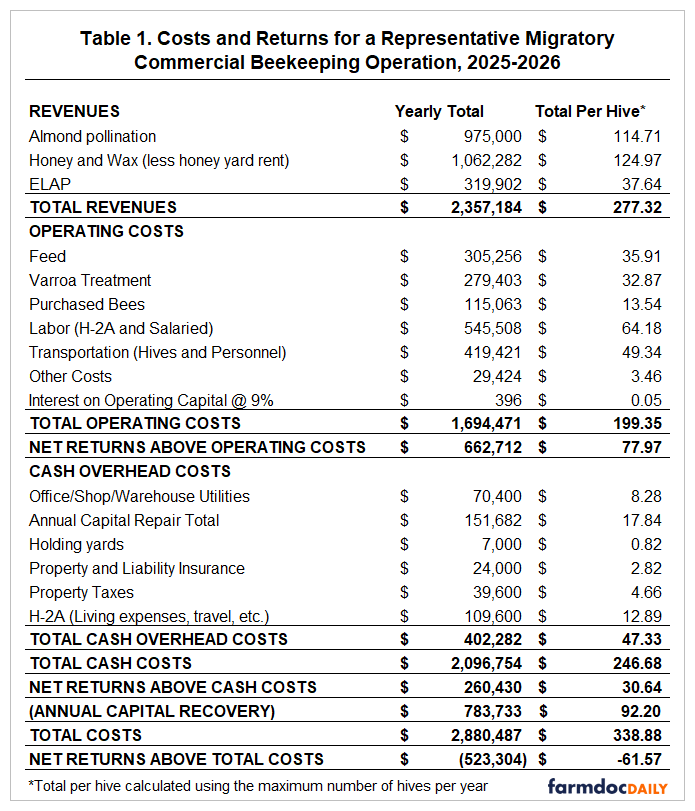
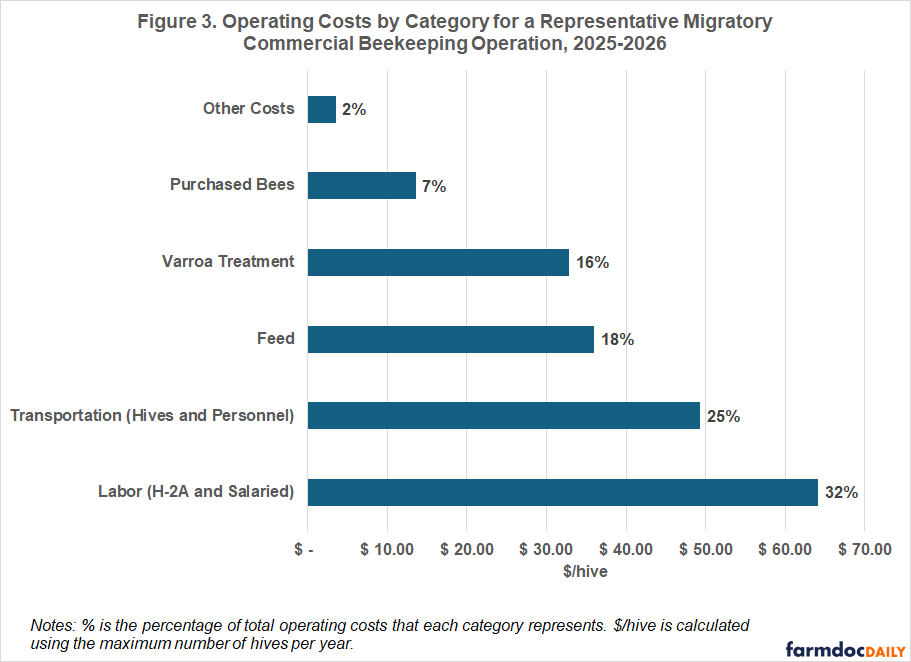
Figure 3 shows major operating cost categories in dollars per colony and as a share of total operating costs. Labor is the largest expense, accounting for 32% of operating costs, followed by transportation (25%), feed (18%), and varroa treatments (16%). Feed, varroa treatments, and purchased bees together highlight the costs of maintaining colony health and replacing lost colonies, a challenge examined in a prior analysis (see farmdoc daily, May 8, 2026). These expenses account for approximately 41% of operating costs, excluding the additional labor required for colony health management and replacement.
Sensitivity of Estimates
We conduct sensitivity analyses of net returns for the two major revenue categories: almond pollination and honey production. Tables 2 and 3 represent abbreviated versions of those in the full study.
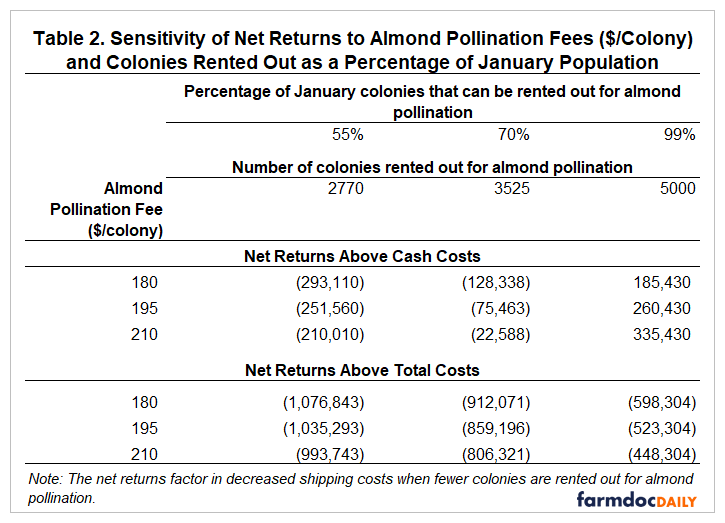
Our baseline assumes that 99% of the 5,036 colonies surviving the winter are rented for almond pollination, which represents a relatively favorable scenario. In reality, some surviving colonies may not meet the minimum standards required by pollination contracts. As shown in Table 2, if only 70% of surviving colonies can be rented for almond pollination at a fee of $195 per colony, the representative operation would not generate enough revenue to cover its annual cash costs. Under this scenario, the operation would face financial challenges even in the short term.
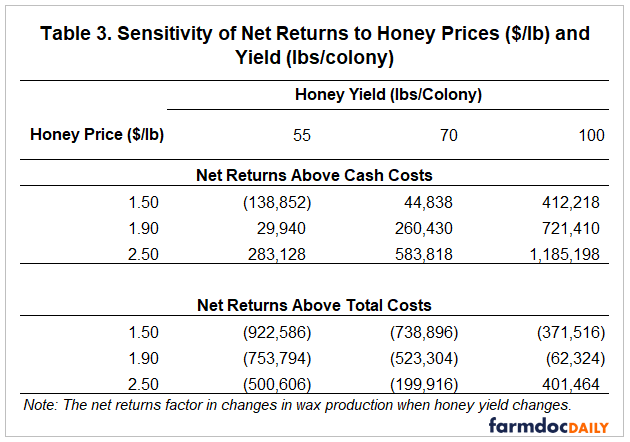
As depicted in Table 3, if honey yields drop by roughly 20% to an average of 55 pounds per colony, this operation is still able to cover cash costs at a price of $1.90 per pound. Though if both yield and price fall by 20%, the operation runs into short-term cash flow problems.
Across both sensitivity analyses (Tables 2 and 3), only the most favorable honey production scenario (high prices and high yields) generates sufficient returns to cover total costs, including capital recovery.
Summary
Our results highlight the narrow margins for commercial beekeeping operations. The representative operation cannot cover total costs and requires government payments to cover cash costs. This highlights the economic impact colony losses and health maintenance have on beekeeping operations. Colony losses and health management impose substantial costs, including labor, feed, pest treatments, and replacement queens, as beekeepers work to maintain colony numbers and operational scale. Continuing issues with colony health suggest uncertainty in the economic sustainability of the industry in the long-term.
References
Altschuler, A., B. Goodrich and J. Janzen. "The High Cost of Honey Bee Colony Losses: Rebuilding Inventories and Managing Health." farmdoc daily (16):81, Department of Agricultural and Consumer Economics, University of Illinois at Urbana-Champaign, May 8, 2026.
Giacobino, Agostina, Nathalie Steinhauer, Samantha Brunner, Natasha Garcia-Andersen, Dan Aurell, Selina Bruckner, Stephanie Rogers, and Geoffrey Williams. 2025. “Preliminary Results from the 2024–2025 US Beekeeping Survey: Honey Bee Colony Loss and Management.” Auburn University, Oregon State University, and Apiary Inspectors of America. Accessed May 6, 2026. US Beekeeping Survey 2024–2025 Results
Goodrich, B. and A. Altschuler. "Where Have All the Honey Bees Gone? To California Almond Orchards." farmdoc daily (15):30, Department of Agricultural and Consumer Economics, University of Illinois at Urbana-Champaign, February 17, 2025.
Paulson, N., G. Schnitkey, C. Zulauf and J. Coppess. "Impacts of Economic Assistance Payments." farmdoc daily (15):4, Department of Agricultural and Consumer Economics, University of Illinois at Urbana-Champaign, January 7, 2025.
Paulson, N., G. Schnitkey, C. Zulauf and B. Zwilling. "Illinois Crop Budgets for 2027." farmdoc daily (16):157, Department of Agricultural and Consumer Economics, University of Illinois at Urbana-Champaign, September 1, 2026.
Schnitkey, G., N. Paulson, B. Zwilling and C. Zulauf. "The Current Grain Farm Financial Position in a Longer-Term Perspective." farmdoc daily (15):221, Department of Agricultural and Consumer Economics, University of Illinois at Urbana-Champaign, December 2, 2025.
Zwilling, B. "2025 Illinois Farm Earnings Improve but Remain Below Recent Averages." farmdoc daily (16):168, Department of Agricultural and Consumer Economics, University of Illinois at Urbana-Champaign, September 18, 2026.
Disclaimer: We request all readers, electronic media and others follow our citation guidelines when re-posting articles from farmdoc daily. Guidelines are available here. The farmdoc daily website falls under University of Illinois copyright and intellectual property rights. For a detailed statement, please see the University of Illinois Copyright Information and Policies here.