








Variable Cash Lease Considerations for 2027
Today’s article revisits a simple design for a variable cash lease for farmland in Illinois. A rent factor is applied to direct crop revenues to determine the variable rent level. The variable lease results in similar rent levels, on average, as cash rents observed by region in Illinois but vary up and down with realized crop revenues. Historically, the variable lease design would have resulted in improved farmer outcomes in poor return periods with negative average farmer returns largely being avoided, and greater returns to landowners during periods of higher revenues and returns. However, the high production costs that have persisted since 2023 combined with lower commodity prices have resulted in negative average returns to rented farmland even with the variable lease. Higher expected commodity prices for the 2026 and 2027 crops imply higher variable lease rents that result in projected average returns that are marginally positive.
Variable Cash Lease
A simple approach to a variable cash lease was originally outlined in farmdoc daily articles in 2021 and 2022 (see farmdoc daily articles from August 10, 2021 and September 20, 2022), with the most recent update to the lease parameters last year (see farmdoc daily article from September 30, 2025). The parameters included:
- A minimum base rent level to provide a guaranteed rent for the landowner and ensure that Farm Service Agency (FSA) requirements are met to be considered a cash lease. A recommended level for the base rent was $100 per acre less than the average cash rent for similar farmland in the region.
- A maximum rent to provide the farmer tenant with a cap on the rent level paid to the landowner. A recommended level for the maximum rent was $100 per acre more than the average cash rent for similar farmland in the region.
- A measure of farm yield agreed upon by the tenant and landlord. Considerations should be given to how yield will be measured when the grain is delivered or stored off-farm vs on-farm, as well as grain quality measures such as moisture and other grain dockage factors.
- A measure of market price to value the grain. An example could be cash price quotes at a specified delivery point and over a period of time agreed upon by the farmer tenant and the landlord.
- A rent factor that is multiplied by crop revenue (farm yield times market price) to determine the variable cash rent level (with the rent level being cupped from below at the minimum rent level and capped from above at the maximum rent level).
Suggested rent factors have been provided for corn and soybeans for each of the 4 crop budget regions in Illinois (north, central-high, central-low, and south). These rent factors have been set such that the average variable cash rent was equal to the average cash rent observed on grain farms enrolled in Illinois FBFM in each region over a specified period of years.
Table 1 provides rent factors based on average crop revenues and cash rents observed on Illinois FBFM grain farms over the most recent 20-year period from 2006 to 2025. This time period aligns with the current “new era” of corn and soybean prices that began with the passage and updating of the Renewable Fuels Standard (RFS) mandates in 2005 and 2007 (see farmdoc daily article from September 27, 2023). Furthermore, it includes 2 cycles of higher price and income periods (2007-2013, 2020-2022) and lower price and income periods (2014-2019, 2023-2025).
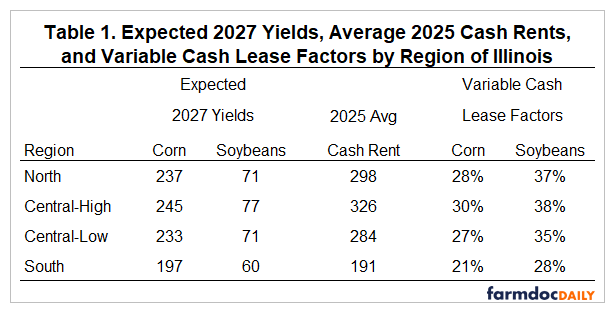
Rent factors for corn are 28% for northern Illinois, 30% for central-high, 27% for central-low, and 21% for the southern region. Rent factors for soybeans are 37% for northern Illinois, 38% for central-high, 35% for central-low, and 28% for southern Illinois. These factors represent measures of the average portion of crop revenue that has gone to pay for rented farmland over the past 20 years.
Variable Cash Rent Calculation
An example calculation is provided using averages for central Illinois, high productivity farmland. In 2025 corn yields and prices averaged 242 bu/acre and $4.09 per bu, respectively, generating an average of $990 per acre in crop revenue. Applying the rent factor of 30% results in a variable cash rent level of $297 per corn acre. Soybean yields and prices averaged 75 bu/acre and $10.24 per bu in 2025, resulting in average crop revenue of $768 per soybean acre. Applying the 38% rent factor results in a variable rent level of $292 per soybean acre.
For a 50-50 corn-soy rotation the average variable rent level for 2025 would have been $294 per acre (0.5*$297 + 0.5*$292 = $294), or $32 below the average cash rent of $326 per acre on high productivity farmland in central Illinois.
The minimum base rent in this example might be somewhere around $225 per acre (roughly $100 below the average cash rent of $326) while an appropriate maximum might be $425 per acre ($100 above the average). These would not impact that calculation here since the calculated variable rents for both corn and soybeans are between the minimum and maximum.
The upper panel of Figure 1 compares the rent levels for the example variable lease and the average rent on high-productivity farmland in central Illinois from 2006 to 2025 along with projected cash rents based on the latest crop budget estimates for 2026 and 2027 (see farmdoc daily article from September 1, 2026). The lower panel illustrates the difference in rents between the variable lease and the average cash rent on Illinois grain farms for each year. Positive differences imply the variable lease resulted in a higher rent level than average cash rents in that year. Negative differences imply the variable lease resulted in a lower rent than the average cash rent.
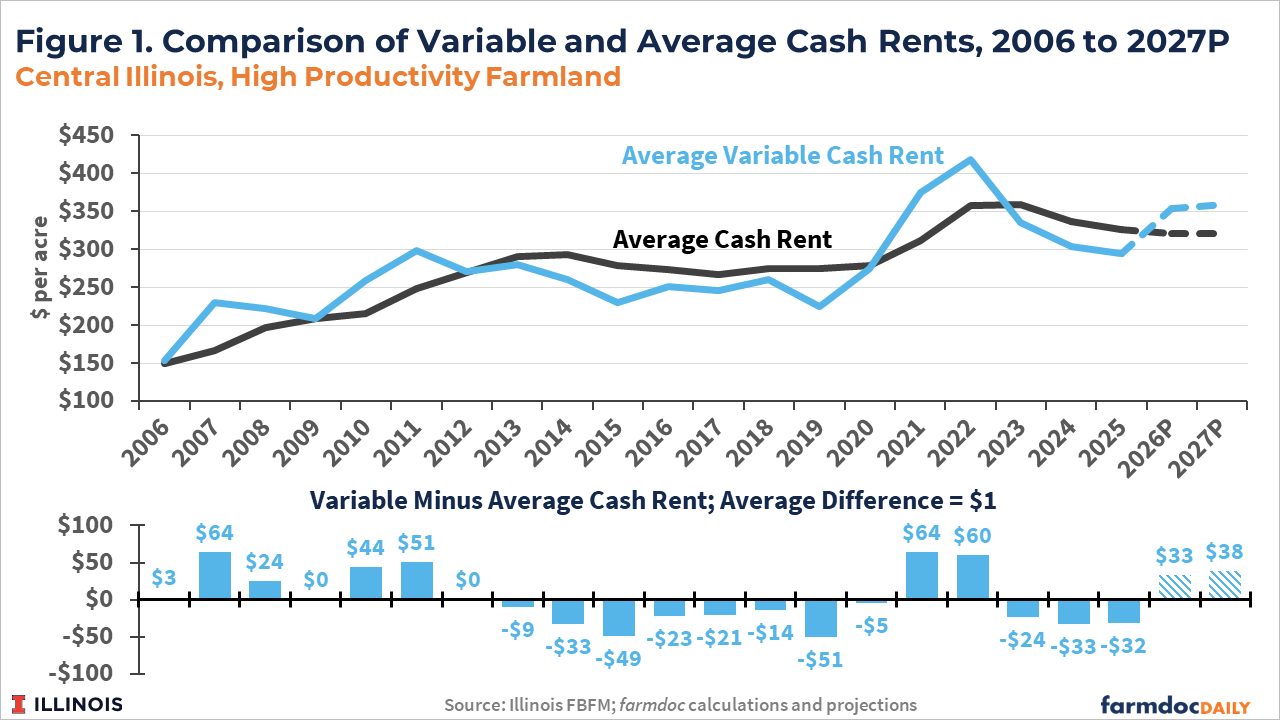
Over the full 20-year historical period from 2006 to 2025 the average difference in rent levels between the variable lease and average cash rents is zero. The variable lease would have led to higher rents from 2006 through 2012 (average difference of $27 per acre), a period of relatively high commodity prices and per acre returns. Average cash rents exceeded those from the variable lease from 2013 to 2020 (average difference of -$25 per acre), a period of lower returns due to a commodity price decline. Higher prices in 2021 and 2022 resulted in the variable lease resulting in rents that exceeded the average cash rent by $64 and $60 per acre, respectively. Lower prices, relative to production costs, from 2023 to 2025 once again resulted in the variable lease resulting in rents lower than the average cash rent (average difference of -$30 per acre).
Projections in the latest farmdoc crop budgets for 2026 and 2027 show a return to higher prices – around $5 per bushel for corn and $12 or more per bushel for soybeans. This would result in rents from the example variable lease that would exceed projected cash rents by more than $30 per acre in 2026 and 2027.
Discussion
The use of variable cash leases in Illinois continues to increase. The 2026 mid-year survey from the Illinois Society of Professional Farm Managers and Rural Appraisers (ILSPFMRA) indicated that 35% of rental agreements are now a form of variable lease compared with just 21% of rental agreements being variable cash leases in ILSPFMRA’s 2020 Land Values Report.
Merits of variable leases include risk-sharing for the tenant and greater upside rent level potential for the landlord based on current economic conditions and relative simplicity compared with share rent agreements as they avoid the landlord needing to be involved with management decisions. While negotiating a variable lease may be more difficult in the beginning, the automatic nature of adjustments to economic conditions can alleviate the need for annual negotiations between the tenant and landlord.
However, variable leases that base the rental payment on a percentage of crop revenues – like the simple design provided here – do not fully address the return situation that has been facing farmers since 2023. Average net farmer returns on cash-rented farmland in Illinois were negative in 2023, 2024, and 2025. While better price prospects over the past few months have resulted in improved return projections for 2026 and 2027, returns still remain relatively close to break-even and below longer-term historical averages (see farmdoc daily article from September 1, 2026). Production costs remain high with ongoing pressures on fertilizer and fuel costs being driven by the conflicts in Iran and between Russia and Ukraine (see farmdoc daily article from August 11, 2026).
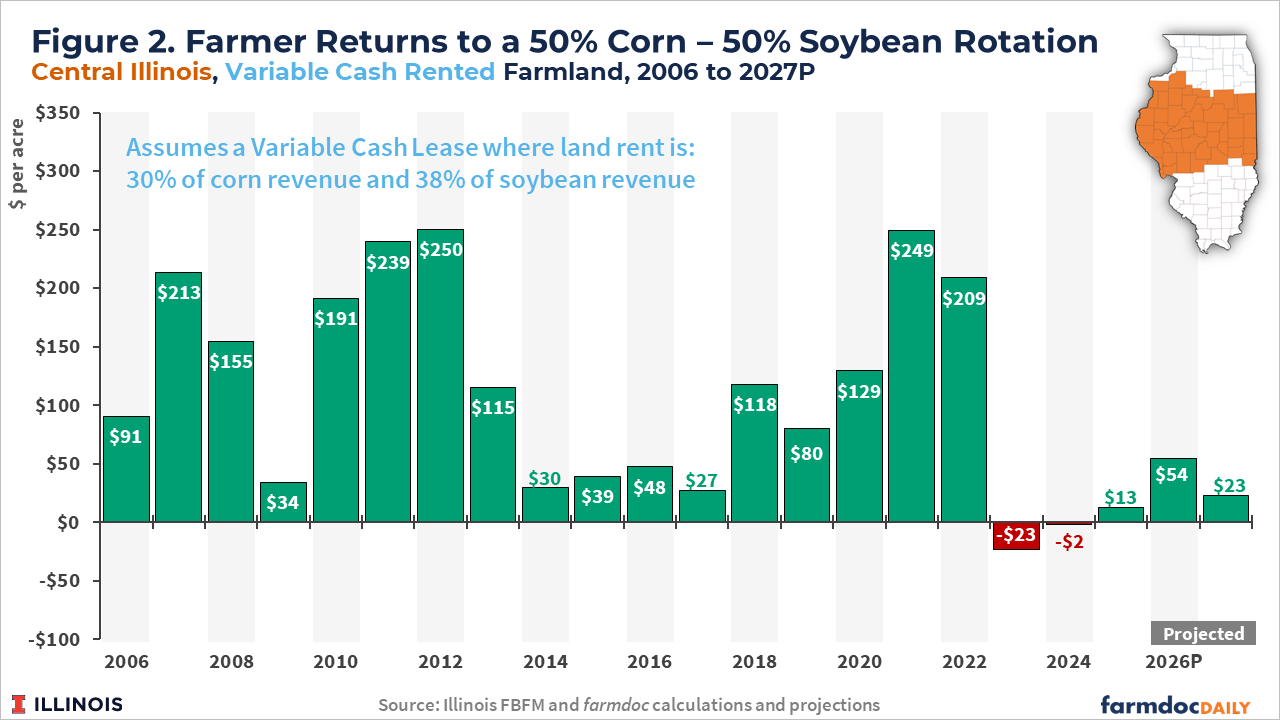
Figure 2 provides net farmer returns for a 50-50 corn-soybean rotation in central Illinois on high-productivity farmland under the example variable cash lease. Average returns would have been negative in 2023 and 2024 even with the variable lease (although less negative than for rental situations at the average cash rent). Returns in 2025, and projected returns in 2026 and 2027, are positive but well below the longer-run average return of around $100 per acre. Notably, projected returns for 2026 and 2027 are slightly lower under the variable lease than with the average cash rents projected for both crop years.
Consideration of Government Payments
Discussions with farmers and landowners in recent months have revealed increased questions and concerns over how to treat government support payments and whether they should be included in the revenues used to calculate rent levels in variable leases. The rent factors outlined here are estimated using direct crop revenues (price times yield) and do not include government payments.
Including government payments in the revenue used to set rent levels adds complexity to the calculation. For example, government support for the current year is often not known at the time when rental payments are made. Commodity programs (ARC/PLC) do not trigger payments until fall harvest (October) of the following crop year. In recent years, ad hoc programs (ECAP for 2024 received in 2025, FBA for 2025 received in 2026) have been provided but have not been finalized and received until the spring of the following year.
Another argument against including government payments in variable lease rent calculations is associated with the high production costs facing farmers. This is particularly true for the most recent rounds of ad hoc support (ECAP and FBA). Most variable leases, including the example provided here, do not include or account for cost increases in their formula. The recent ad hoc payments have been justified by and helped to partially offset, at least in the short term, the impact of higher costs.
If consideration for government payments is to be made explicit in a variable lease design, appropriate rent factors would be lower than those presented above in table 1. If government payments are included with direct crop revenues, the rent factors for corn acres should adjust down by 1-2% while the factors for soybeans should decline by 2-3%.
Summary
Variable cash leases continue to increase in use in practice. We provide a relatively simple example for how a variable cash lease could be designed where the rent is determined by applying a factor to a measure of the direct crop revenues generated for the crop year. We provide estimates of factors by crop (corn and soybeans) and region for Illinois, where the factors are set such that the rents resulting from the variable lease design would roughly equal the average cash rents observed over the 20-year period from 2006 to 2025.
The variable lease will result in larger rents during higher crop revenue periods and lower rents during lower crop revenue periods, providing some natural risk protection for the farmer tenant while also providing landowners with upside rent potential under better revenue conditions. Historically, the example variable lease would have helped the farmer tenant avoid most negative return outcomes while giving up some of the highest returns. However, the high production costs that have persisted since 2023 have resulted in some negative average returns even with the variable lease design. The higher prices currently projected for 2026 and 2027 would imply higher rents from the example variable lease than current projections of average cash rents, lowering return projections for the farmer closer to break-even levels.
References
Irwin, S. and D. Good. "The New Era of Crop Prices: A 15-Year Review." farmdoc daily (13):176, Department of Agricultural and Consumer Economics, University of Illinois at Urbana-Champaign, September 27, 2023.
Paulson, N., G. Schnitkey, C. Zulauf and B. Zwilling. "Illinois Crop Budgets for 2027." farmdoc daily (16):157, Department of Agricultural and Consumer Economics, University of Illinois at Urbana-Champaign, September 1, 2026.
Paulson, N., G. Schnitkey, R. Batts, B. Zwilling and C. Zulauf. "Fertilizer and Fuel Prices Higher Heading into Fall 2026." farmdoc daily (16):143, Department of Agricultural and Consumer Economics, University of Illinois at Urbana-Champaign, August 11, 2026.
Paulson, N., G. Schnitkey and C. Zulauf. "Revised Variable Cash Lease Parameters." farmdoc daily (15):179, Department of Agricultural and Consumer Economics, University of Illinois at Urbana-Champaign, September 30, 2025.
Schnitkey, G., C. Zulauf, K. Swanson and N. Paulson. "A Straight-Forward Structure for a Variable Cash Rent." farmdoc daily (11):117, Department of Agricultural and Consumer Economics, University of Illinois at Urbana-Champaign, August 10, 2021.
Schnitkey, G., C. Zulauf, N. Paulson, K. Swanson, J. Coppess and J. Baltz. "A Straight-Forward Variable Cash Lease with Revised Parameters." farmdoc daily (12):145, Department of Agricultural and Consumer Economics, University of Illinois at Urbana-Champaign, September 20, 2022.
Disclaimer: We request all readers, electronic media and others follow our citation guidelines when re-posting articles from farmdoc daily. Guidelines are available here. The farmdoc daily website falls under University of Illinois copyright and intellectual property rights. For a detailed statement, please see the University of Illinois Copyright Information and Policies here.