


Budget-Driven Crop Insurance Coverage Options for 2024
Relative to 2022 and 2023, 2024 is projected to be a low to negative margin year for many grain farmers in Illinois. Because of lower commodity prices, per acre guarantees offered by crop insurance will be lower in 2024 than in 2023. Lower guarantees, along with stubbornly high costs, leads to a dilemma for farmers. Producers may seek crop insurance coverage with lower premium costs as part of broader cost reducing efforts. However, strategies which reduce farmer-paid premium may in turn reduce insurance guarantees or other risk reduction aspects of their insurance coverage, thereby increasing risk exposure. We evaluate options, with a particular emphasis on coverage resulting in farmer-paid premium costs for corn between $23 and $35 per acre in central Illinois. Historically, most farmers have chosen insurance options with premium costs that fall in this range.
The 2024 Situation
Farmers face much lower margin and return prospects in 2024, with the average cash rent projected to result in negative returns to corn and soybean production across Illinois. A major contributor to these lower margins are lower commodity prices, which have also resulted in lower projected prices used to set crop insurance guarantees. The projected price for corn in 2024 is $4.66, down 21% from the $5.91 price in 2023. The projected price for soybeans in 2024 is $11.55, down 16% from the $13.76 price in 2023. These lower prices will result in lower premium costs for policies than the last few years, but also much lower guarantees (see farmdoc daily articles from February 13 and March 4, 2024 for further discussion).
While commodity prices have fallen, costs remain stubbornly high. According to farmdoc crop budgets for the high-productivity region of central Illinois, the average non-lands costs (without crop insurance premium expenses) are expected to be around $775 per acre. Average cash rent, our typical indicator for land costs, are expected to remain around $350 per acre for 2024, resulting in total costs of around $1,125 per acre for cash rent farmland ($775 + $350).
Crop insurance, even at high coverage levels will not cover those costs. Take, as an example, a farm with a trend-adjusted actual production history yield (TA-APH) of 225 bushels per acre. Minimum guarantees under Revenue Protection (RP) will be:
- 85%: 225 TA-APH yield x $4.66 x 85% coverage level = $891
- 80%: 225 TA-APH yield x $4.66 x 85% coverage level = $839
- 75%: 225 TA-APH yield x $4.66 x 85% coverage level = $786
Note that all those per acres guarantees are considerably below total costs. A farmer may be able to use crop insurance to cover non-land costs ($775). But if rented land represents a significant portion of the operation, or much debt remains on farmland, the land portion of costs will not be covered. Further note that the $4.66 projected price is based on future contracts. Cash prices received by farmers are typically below futures prices, with a usual basis being about $.30 per bushel. Hence, the RP guarantees based on futures contracts overstate true revenue coverage levels.
Insurance Options: Supplemental and Enhanced Coverage Option
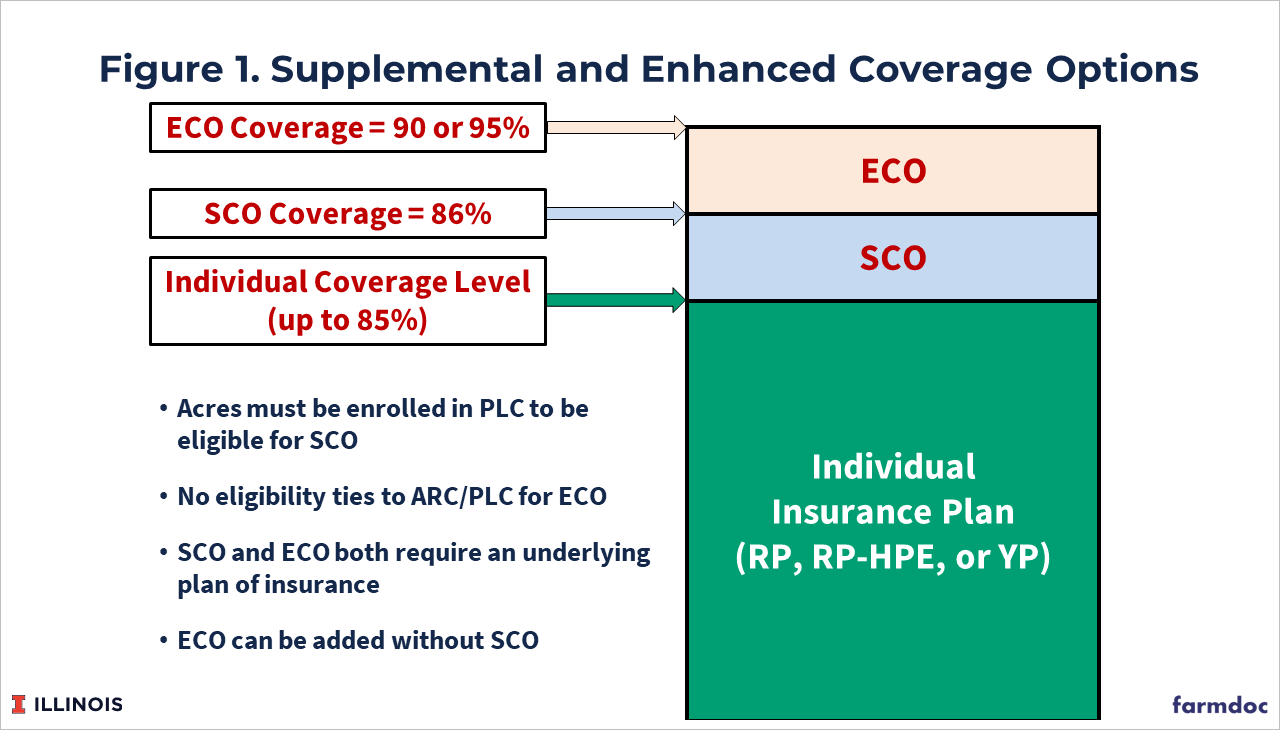
Given the high production costs and lower RP guarantees, producers may be interested in adding additional coverage in 2024. Within the subsidized Federal crop insurance program there exist supplemental area-based plans that could be used for this purpose. The Supplemental and Enhanced Coverage Options (SCO and ECO) provide county-based coverage that can cover a portion of the producer’s deductible when paired with an underlying individual plan.
Illustrated in Figure 1, SCO provides coverage from 86% down to the coverage level of the individual plan while ECO has options at the 90% and 95% coverage levels which both extend down to the 86% level. For both SCO and ECO, the coverage type (revenue, yield, harvest price etc.) mimics the underlying policy. Thus, SCO and ECO can be stacked with the producer’s individual plan to increase the total coverage level.
For the example corn farm, adding SCO to RP would increase the minimum guarantee to $901 per acre (0.86 x $4.66 x 225). ECO at 90% or 95% would increase the guarantee to $944 and $996 per acre, respectively. However, the additional coverage is based on county yields and insurance prices rather than farm yields, so the additional coverage and payments from the supplemental plans won’t always align with losses experienced at the farm level.
SCO was introduced in the 2014 Farm Bill and discussed in more detail in the farmdoc daily from February 27, 2014. ECO was introduced in 2021 and discussed in the farmdoc daily from November 24, 2020.
Coverage Combinations Using Revenue Protection
Table 1 reports premium estimates for coverage combinations using RP as the underlying individual plan. We focus on RP here as it is the most popular policy type for corn in general with the majority of acres covered under RP and in Illinois, in particular, producers tend to elect relatively high coverage for their RP plans (see farmdoc daily articles from January 29, 2019 and November 17, 2020).
Highlighted within Table 1 are options that have total premium cost estimates between $23 and $35 per acre, a rough range of premium levels that farmers have revealed they are willing to pay through time (see historic Revenue and Costs for Illinois Grain Crops) . The upper panel provides premium estimates for RP coverage levels from 70% up to 85% in the rows, and for different RP combinations using SCO and ECO across the columns, assuming enterprise units. The middle panel is organized in the same way but provides premium estimates assuming basic units. The bottom panel assumes optional units. Premiums are lowest for enterprise units due to higher subsidy rates and more risk diversification for that unit structure. Basic and optional units involve more risk based on their structure as well as lower subsidy rates, resulting in higher premium costs. The different unit rate structures are discussed in more detail in the farmdoc daily from June 12, 2023.
For enterprise units, the estimated premium for 85% RP coverage for the example farm is $23.98 per acre, providing a minimum revenue guarantee of $891 per acre. Lower RP coverage levels would reduce both the premium costs and revenue guarantee (see first column for ‘RP only’ in Table 1).
Adding SCO to RP (+SCO column) increases the producer’s total coverage level to 86%, but with county-based revenue coverage for the band from 86% down to the RP coverage level. Adding SCO to 85% RP only adds an additional 1% of county coverage and a total premium cost of $25.29 per acre. Again, reducing the RP coverage level and combining with SCO will lower total premium cost but also expands the size of the band covered by the county-based SCO policy.
Using RP 85% and adding SCO and ECO at 90% pushes the premium cost above $35 per acre, but lower RP coverage levels with SCO and ECO-90 result in total premium costs in the $25 to $27 range (see column labeled ‘+SCO+ECO-90’). Combining SCO, ECO-95, and RP pushes premium costs into the $40+ range per acre, regardless of the underlying RP coverage level (see column labeled ‘+SCO+ECO-95’). Removing SCO and using ECO alone with the underlying RP plan can also generate some premium costs in the target range but creates a coverage gap from 86% down to the RP plan’s coverage level. RP 85% plus ECO 90% has a premium cost of $34.58 per acre and leaves only the 1% band from 86% to 85% as a gap between the RP and ECO policies. Using ECO 95% with RP can result in premium costs in the $30-$35 per acre range if RP coverage is 75% or lower but leaves a more sizeable gap between RP and ECO coverage.
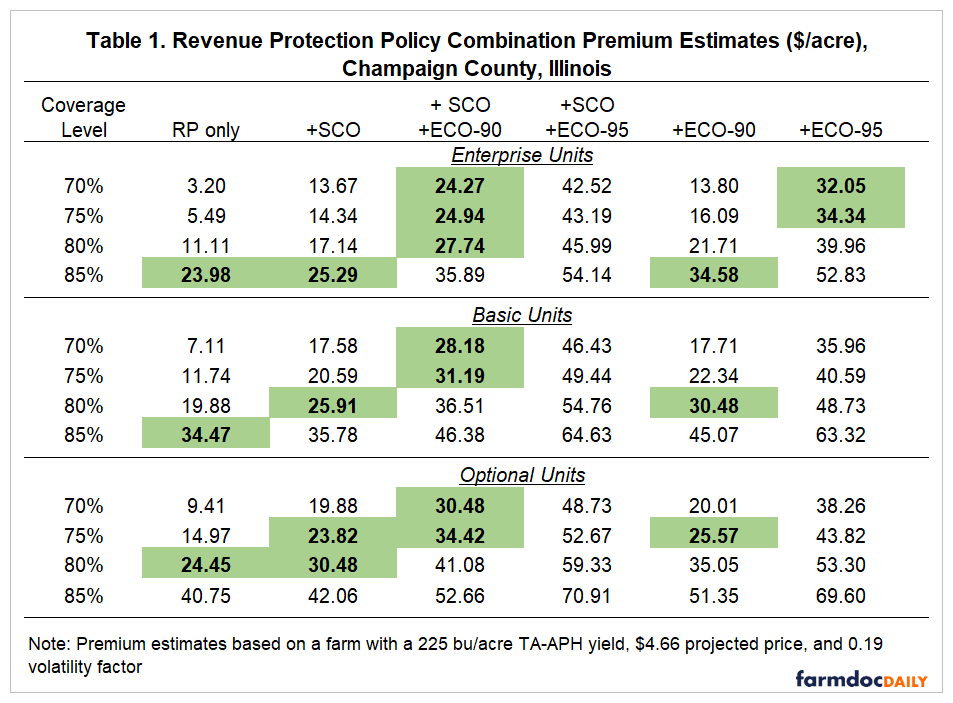
Basic and optional unit combinations can also achieve higher coverage with premium costs in the target range but the higher costs of these unit structures requires lower RP coverage levels. RP at 85% is still below $35 per acre for basic units, but exceeds $40 per acre under optional units. Combining SCO and ECO 90% with RP at lower coverage levels can result in premium costs in the target range. The higher RP premium costs for basic and optional units and the high premium cost of ECO 95% make it difficult to identify coverage combinations with premium costs below $40 per acre, and can easily be in the range of $50 to $70 per acre in total premium when combined with the higher RP coverage levels.
Coverage Combinations with Revenue Protection – Harvest Price Exclusion and Yield Protection
Table 2 is organized in the same way as Table 1 but reports premium cost estimates using Revenue Protection with the Harvest Price Exclusion (RP-HPE) as the individual policy. RP-HPE premiums tend to be significantly lower than RP as RP-HPE does not adjust it’s coverage guarantee to the harvest price.
Given the lower premium cost of RP-HPE, more combinations exist within the total premium cost target range of $23 to $35 per acre. An 85% RP-HPE policy would cost $24.09 even with optional units. Premium costs for enterprise units are below or within the target range even when adding SCO and ECO 90% or ECO 95% coverage. Use of basic or optional units might require lowering the RP-HPE coverage level, and expanding the band of county-based coverage, but combinations with ECO 95% are still achievable at premium costs below $35 per acre.
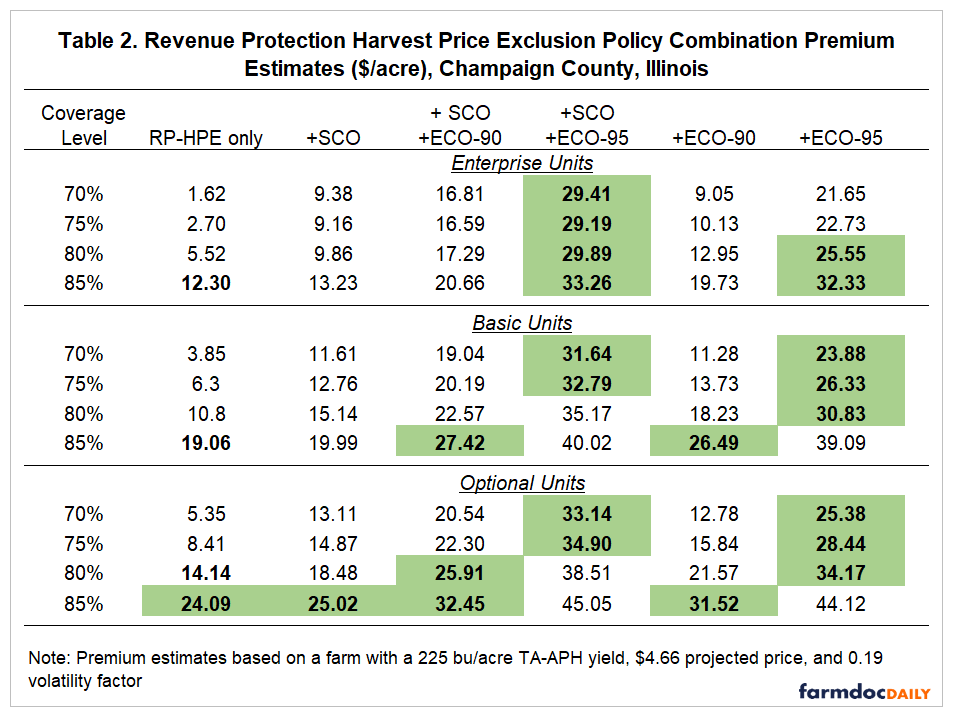
RP-HPE has lower premium because its guarantee will not increase if the harvest price is above the projected price. Hence, RP-HPE provides the same downside revenue risk protection as RP. However, RP-HPE will not provide as much risk protection as RP in years of rising prices. In drought years like 2012, for example, RP-HPE will have significantly lower payments than RP. RP-HPE is best for those who do not pre-harvest hedge much of their production. Those producers that hedge over 30% of the production before June likely will be better suited for RP.
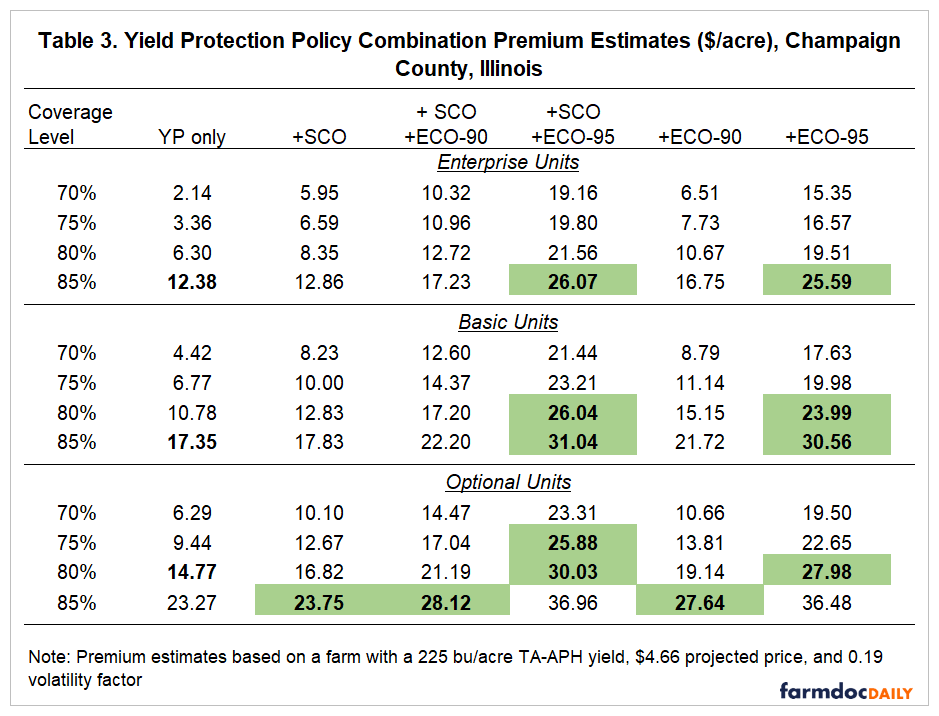
Table 3 provides premium cost estimates for coverage combinations with Yield Protection (YP) as the underlying policy. The premium costs for YP are similar to those for RP-HPE across coverage levels. Thus, similar to the RP-HPE examples, coverage combinations exist that include both SCO and ECO at 95% and have a total premium cost below or within the target range of $23 to $35 per acre.
YP premiums are lower than RP premiums because YP provides yield loss protection only and does not include the harvest price provision. Yield losses, if they occur, are always compensated at the projected price. In drought years like 2012, where major yield losses coincide with high price levels, RP will provide larger payments than YP as losses will be valued at the higher harvest price.
Summary
Historically, evidence has shown that producer crop insurance decisions may be at least partially budget-driven, with per acre premium expenses often falling within a range on a dollar per acre basis. The budget approach to insurance decisions may be even more likely to impact insurance choices in a year like 2024 where margins are expected to be very tight due to lower prices and continued higher production costs.
Lower prices have also resulted in lower projected prices and guarantees for insurance products. Producers may be interested in insurance coverage options which manage premium expense without giving up significant risk reduction through lower guarantees.
The supplemental area insurance plans, SCO and ECO, can be combined with an underlying plan of insurance (RP, RP-HPE, or YP) to increase coverage. Premium expense can be managed through individual coverage level adjustments and or unit structure choices. However, using supplemental plans while also keeping total premium costs within the target range of $23 to $35 involves tradeoffs between farm-level and county-based coverage as well as potential gaps in coverage. Producers need to consider and evaluate these tradeoffs to determine if they make sense for their operation.
An example for Champaign County Illinois shows that total premium cost in the $23 to $35 per acre range can be achieved for RP with SCO and ECO 90% coverage if the producer is willing to lower RP coverage to 80% or lower. Combinations with ECO 95% which also control premium costs are more difficult to achieve with RP. Shifting to RP-HPE or YP as the underlying plan of insurance creates more options for coverage combinations that include ECO 95% and/or optional or basic units.
Final Note: Crop Insurance Decision Tools
The premium estimates in this article for both individual and county-level supplemental insurance plans were generated using the iFARM Premium Calculator in the Excel-based 2024 Crop Insurance Decision Tool, one of a suite of crop insurance decision tools available on farmdoc. This Excel spreadsheet tool can be downloaded and used offline.
Other crop insurance tools available on farmdoc include:
Crop Insurance Premium Calculator (web-based): The web-based Premium Calculator tool will provide premium estimates for different policies, coverage levels, and unit structures customized to the user based on their location (State and County) and individual insurance parameters such as their actual production history yield, rate yield, trend adjustment, practice, etc.
Crop Insurance Payment Evaluator: This web-based tool will provide the user with estimates of the net cost of insurance and risk reduction provided by different policy and coverage level combinations. Results are generated for case farms at the county level for corn and soybeans with near complete coverage of counties in 10 States within the major corn and soybean producing regions of the US.
References
Paulson, N. and J. Coppess. "2014 Farm Bill: The Supplemental Coverage Option." farmdoc daily (4):37, Department of Agricultural and Consumer Economics, University of Illinois at Urbana-Champaign, February 27, 2014.
Paulson, N., G. Schnitkey, K. Swanson and C. Zulauf. "The New Enhanced Coverage Option (ECO) Crop Insurance Program." farmdoc daily (10):203, Department of Agricultural and Consumer Economics, University of Illinois at Urbana-Champaign, November 24, 2020.
Paulson, N., G. Schnitkey, C. Zulauf and R. Batts. "First Look at Crop Insurance Decisions for 2024." farmdoc daily (14):30, Department of Agricultural and Consumer Economics, University of Illinois at Urbana-Champaign, February 13, 2024.
Schnitkey, G. "Revenue Protection Most Popular Crop Insurance Choice in Illinois." farmdoc daily (9):16, Department of Agricultural and Consumer Economics, University of Illinois at Urbana-Champaign, January 29, 2019.
Schnitkey, G., N. Paulson, C. Zulauf and K. Swanson. "Revenue Protection: The Most Used Crop Insurance Product." farmdoc daily (10):198, Department of Agricultural and Consumer Economics, University of Illinois at Urbana-Champaign, November 17, 2020.
Sherrick, B., G. Schnitkey and N. Paulson. "Crop Insurance Decisions for 2024." farmdoc daily (14):44, Department of Agricultural and Consumer Economics, University of Illinois at Urbana-Champaign, March 4, 2024.
Zulauf, C., G. Schnitkey, J. Coppess and N. Paulson. "The Importance of Insurance Unit in Crop Insurance Policy Debates." farmdoc daily (13):107, Department of Agricultural and Consumer Economics, University of Illinois at Urbana-Champaign, June 12, 2023.
Disclaimer: We request all readers, electronic media and others follow our citation guidelines when re-posting articles from farmdoc daily. Guidelines are available here. The farmdoc daily website falls under University of Illinois copyright and intellectual property rights. For a detailed statement, please see the University of Illinois Copyright Information and Policies here.