


Measuring Farm Policy, Part 4: Basic Input Costs and Payments
While it may open with April Fools’ Day, for baseball fans April is the historical home to Opening Day and the beginning of a new season. The wonderful oddity of the former may trace its roots to 1582 when France adopted the Gregorian calendar, moving New Year’s day from April 1 to January 1 (Winick, March 28, 2016). Baseball’s spring ritual traces to the founding of the National League in early 1876, followed by the first opening day on April 22nd at the Jefferson Street Grounds in Philadelphia (Rothenberg; Nathan, 2013; Voight, 1970). Neither folklore nor prank, April marks four months into 2024; there is no joy in Farm Bill-ville, however, because neither team has even taken the field (see e.g., Thayer). The chances of Farm Bill reauthorization in 2024 grow more dim with each passing day and analysis begins to take on the tenor of postmortem. Measuring farm policy, its own version of Moneyball; today’s article offers crop production’s input costs for perspective (Lewis, 2004).
Background
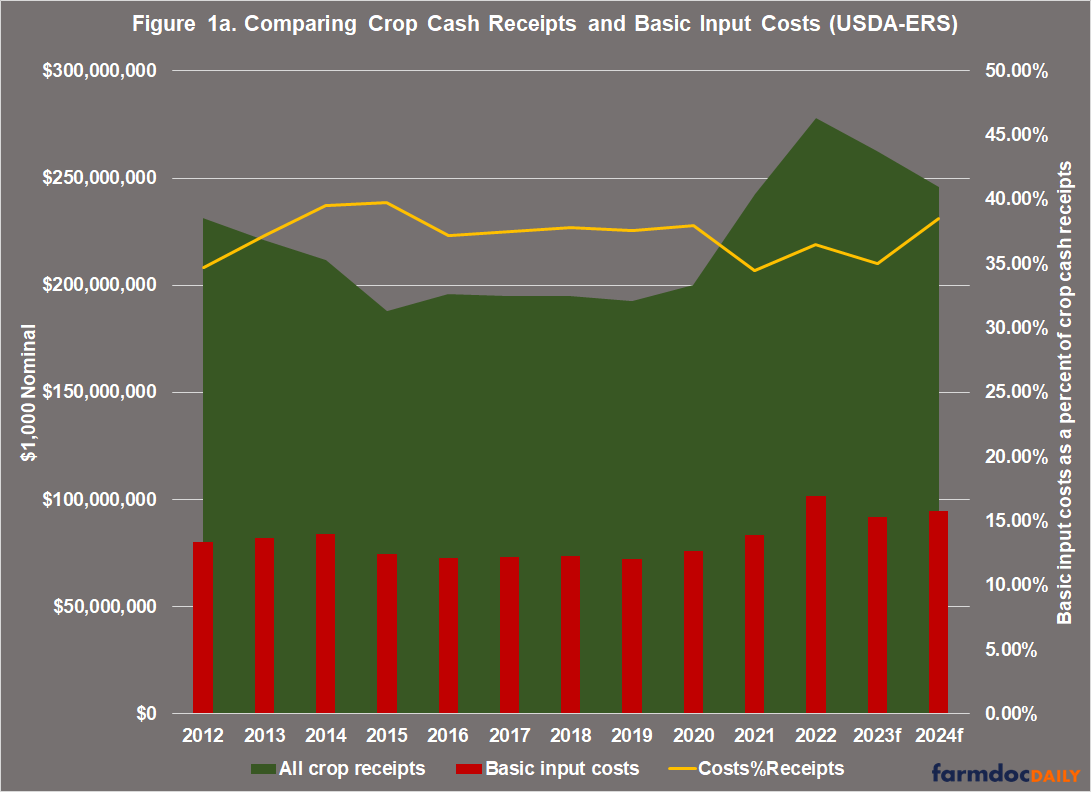
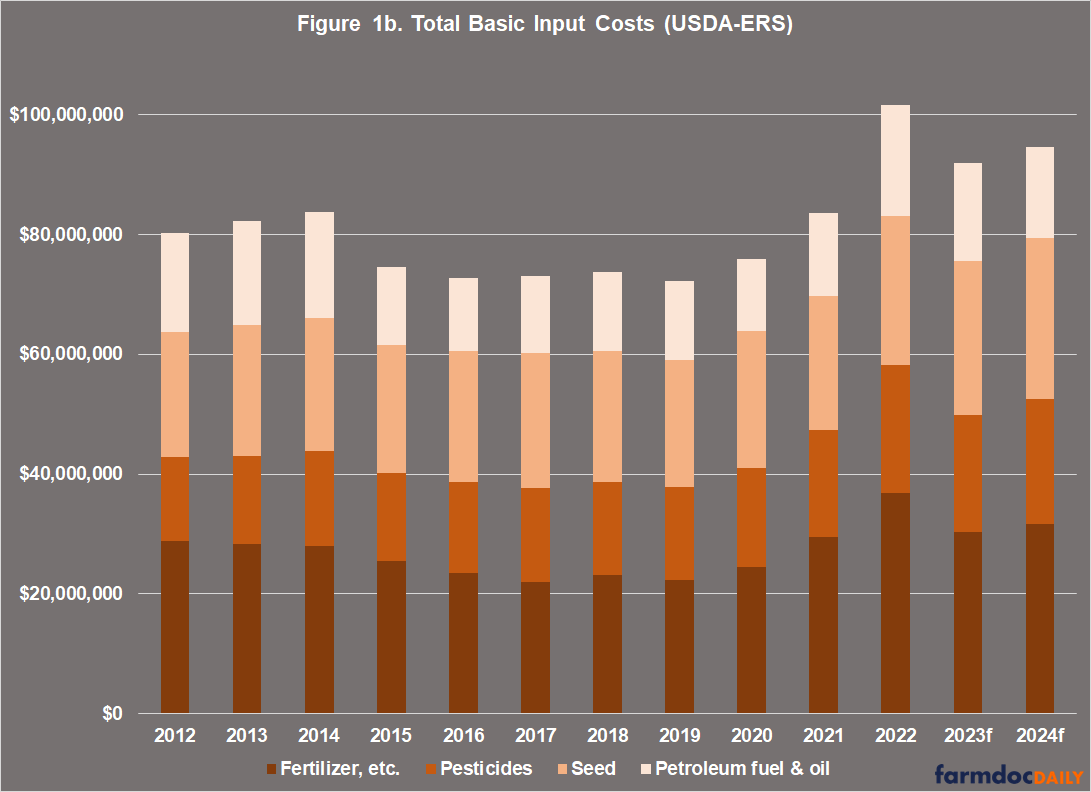
The discussion below uses the data reported by USDA’s Economic Research Service in February, on a nominal basis and not adjusted for inflation (USDA-ERS, Farm Income and Wealth Statistics, February 7, 2024). Figure 1a compares the national amounts for crop cash receipts (green area) and basic input costs (red bars) back to 2012, including the 2023 and 2024 forecasts. It also illustrates the basic input costs as a percent of crop cash receipts. The basic input costs used are the seed, fertilizer, pesticides and petroleum fuel and oil costs reported at the National and State level. These are not all costs incurred by farmers but, outside of land and machinery costs, these are arguably the primary (or most basic) costs of producing a crop. Since 2012, these costs have averaged 37% of total crop cash receipts, ranging from a low of 34.5% (2021) to a high of nearly 40% (2015). In other words, these basic input costs generally consume about 35-40% of the income from the crops they are used to produce. Figure 1b illustrates the basic input costs.
Combined, the stacked bars in 1b equal the red bars in Figure 1a. Of these, farmers spent the largest share on fertilizer, averaging 33% over these years. Spending on seed costs (28%) was second, followed by pesticides (20.5%) and petroleum fuel and oil (18%). The spike in costs in 2022 is clear (133% of the average from 2012 to 2020), led by fertilizer (146.5% of the average from 2012 to 2020) (see also, farmdoc daily, June 14, 2016; December 14, 2021; February 28, 2023; June 13, 2023; August 1, 2023; August 15, 2023; September 19, 2023). ERS is projecting reduced costs for 2023 and 2024.
Discussion
This discussion continues the effort to measure farm policy (farmdoc daily, February 1, 2024; February 8, 2024; March 8, 2024). Viewed from the topline, government payments are not large relative to crop cash receipts. Figure 2a compares the two, including payments (light blue area) as a percent (navy line) of cash receipts (green area). Overall, government payments have averaged 7.6% of all crop cash receipts, ranging from a high of 22.8% in 2020 to an expected low of 4.2% in the forecast for 2024. Figure 2b illustrates the government payments by category: commodities programs in Title I of the Farm Bill; conservation programs in Title II of the farm bill; and the ad hoc, supplemental, or miscellaneous payments that are not authorized in the Farm Bill. The stacked bars in 2b add up to the total payments in Figure 2a. Admittedly, this is not an exact match. Farm program or commodities program payments in Title I are limited to a subset of farms based on eligible commodities, while conservation and ad hoc or supplemental assistance are typically available to more farmers, including livestock producers.
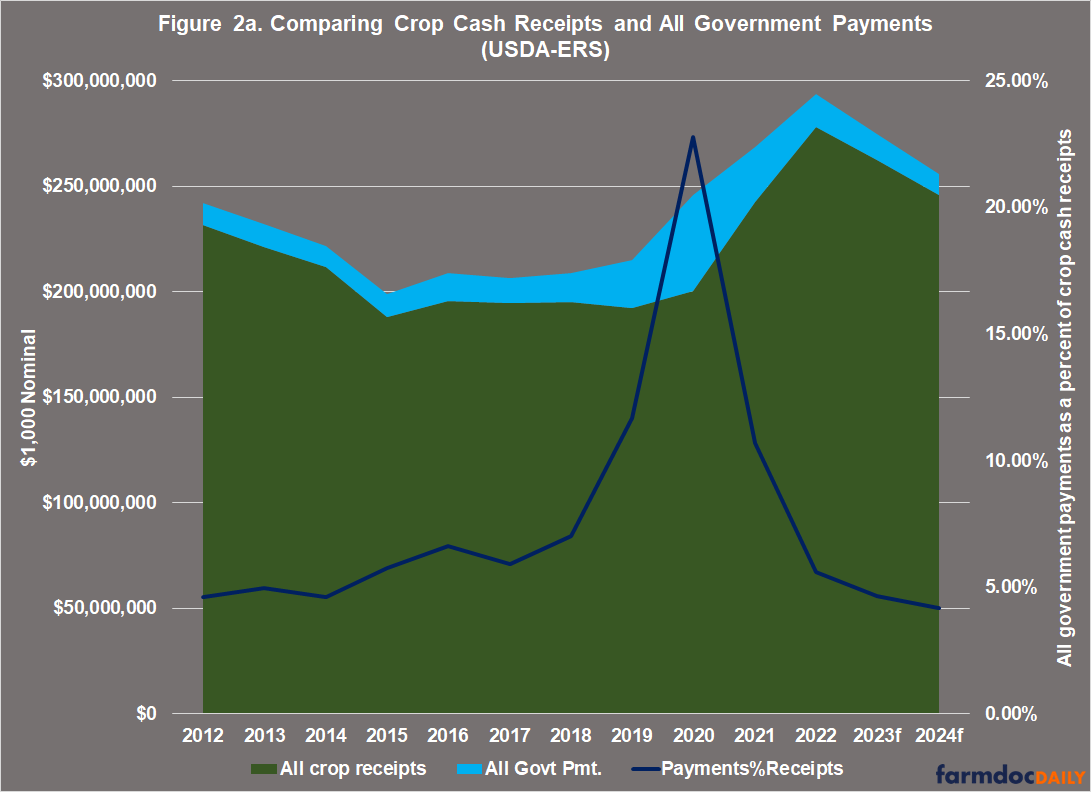
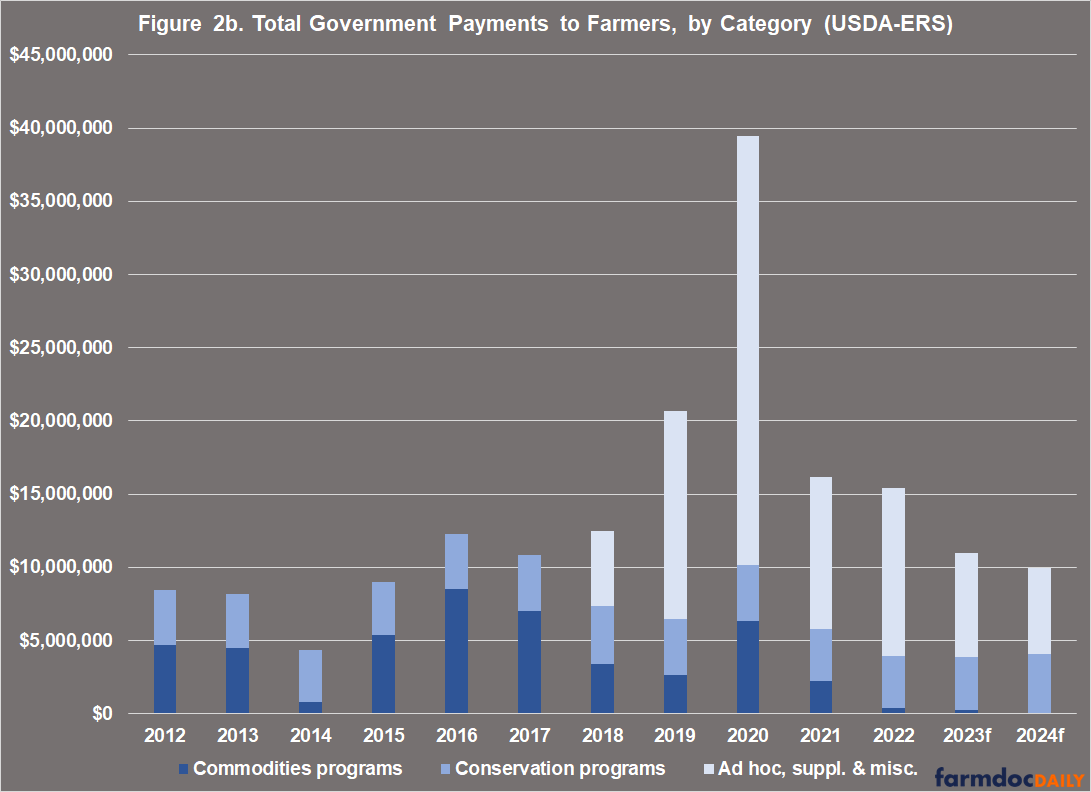
It is noticeable the degree to which ad hoc and supplemental payments since 2018 have upended government payments to farmers. High crop prices in recent years (including 2023 and 2024 forecasts), moreover, have resulted in a forecast for almost no farm program payments in 2024 due to the counter-cyclical design of the policies.
Figure 3 compares the national-level data for basic input costs and government program payments to farmers. It also highlights the challenging expectations for payments likely contributing to the difficulties for reauthorizing the Farm Bill (see e.g., farmdoc daily, June 15, 2023; June 22, 2023). Substantial reductions in payments are more noticeable in the wake of recent experiences with an inflationary spike in basic input costs and crop prices, as well as the extraordinary ad hoc and supplemental payments. In 2020, for example, government payments exceeded 50% as compared to basic input costs, falling in the years after while costs spiked. Because payments provide income to farmers, they can be understood to help defray the costs of producing crops. The extent to which the spike in payments contributed to the spike in costs is a question beyond this analysis but one worth exploring.
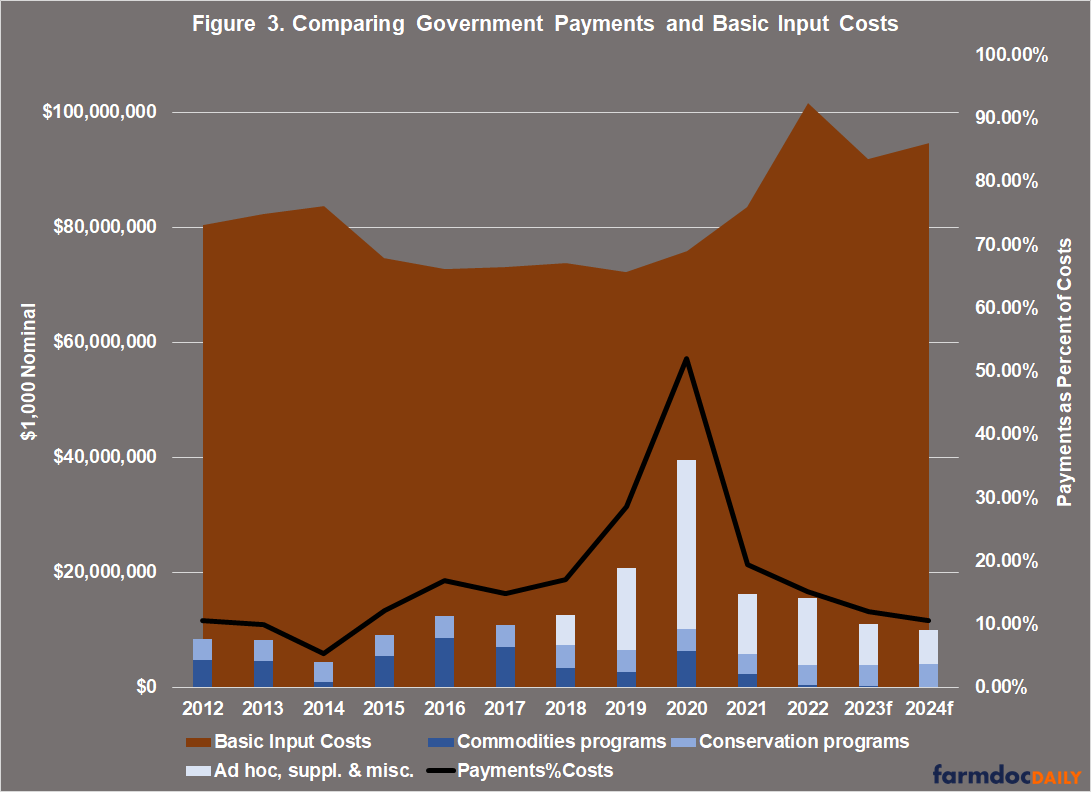
Figure 4 maps this measure of farm policy for the years 2012 to 2022. The primary measure compares the farm program payments in Title I to the basic input costs, with conservation payments and ad hoc or supplemental payments also included. Farm program payments provide a relatively close match for the basic input costs, although not exact. Overall, the national average of farm program payments compared to basic input costs was just over 5% from 2012 to 2022. A total of nearly $45 billion in farm program payments were made in these years compared to a total of nearly $874 billion spent on these basic inputs. In other words, at the National level roughly 5% of basic input costs could be considered covered by these payments. The categories in the map are built around that national average with two categories below 5% and two above it.
The map also offers context for Farm Bill reauthorization and the political issues complicating Congressional efforts to make any progress. Government payments help cover some of the costs of producing a crop, making the decrease in payments at a time of elevated costs potentially more consequential. It likely fuels demands for increasing payments such as through raising reference prices. The differences among farmers and states add complications and challenges. All farmers experience reduced payments at a time of higher basic input costs, but it would be more acute in those states where farmers have received larger payments as a share of basic input costs. Too narrow of a focus on payments and costs, however, misses other realities and risks overstating matters considerably.
Concluding Thoughts
The impasse over Farm Bill reauthorization continues into the fourth month of this calendar year with little optimism for resolution. Efforts to measure farm policies provide insights into policy design and the political issues complicating reauthorization. Government payments to farmers can help with the costs of producing crops for those farmers who receive the payments. As measured against the basic input costs for producing crops (fertilizer, seed, pesticides, and fuel and oil), the regional disparities in farm program payments once again show up. It is predominantly farmers in southern states who receive more than the national average. These disparities are notable for reasons more than political. Keeping in mind that program payments are decoupled from production, they offer competitive advantages when farmers plant the same crops or use the same inputs but receive significantly different payments. There is little doubt that these disparities are fueling at least some of the demands that are causing the impasse. Measuring farm policy provides data points about the design of farm programs and raises concerns about inequities or disparities. Future efforts to measure farm policies will contribute additional perspectives.
References
Coppess, J. "Farm Bill 2023: Trying to Reason with Expectations for Farm Policy." farmdoc daily (13):110, Department of Agricultural and Consumer Economics, University of Illinois at Urbana-Champaign, June 15, 2023.
Coppess, J. "Farm Bill 2023: Another Side of Expectations Management for Farm Policy." farmdoc daily (13):114, Department of Agricultural and Consumer Economics, University of Illinois at Urbana-Champaign, June 22, 2023.
Coppess, J. "Measuring Farm Policy, Part 3: Year One with Inflation Reduction Act Funding." farmdoc daily (14):48, Department of Agricultural and Consumer Economics, University of Illinois at Urbana-Champaign, March 8, 2024.
Coppess, J. "Measuring Farm Policy, Part 2: Conservation & A Nutrient Loss Reduction Perspective." farmdoc daily (14):27, Department of Agricultural and Consumer Economics, University of Illinois at Urbana-Champaign, February 8, 2024.
Coppess, J. "Measuring Farm Policy, Part 1: Cash Receipts and Program Payments." farmdoc daily (14):22, Department of Agricultural and Consumer Economics, University of Illinois at Urbana-Champaign, February 1, 2024.
Lewis, Michael. Moneyball: The Art of Winning an Unfair Game. (W.W. Norton & Company, 2004).
Nathan, David A. “Review: A People’s History of Baseball.” NINE: A Journal of Baseball History and Culture 21, no. 2 (2013): 144-147.
Paulson, N., C. Zulauf, G. Schnitkey and J. Baltz. "Fertilizer Prices Continue Year-Long Decline from 2022 Peak." farmdoc daily (13):142, Department of Agricultural and Consumer Economics, University of Illinois at Urbana-Champaign, August 1, 2023.
Paulson, N., C. Zulauf, G. Schnitkey, J. Colussi and J. Baltz. "Variability in Nitrogen Fertilizer Prices in Illinois Over the Last 15 Years." farmdoc daily (13):170, Department of Agricultural and Consumer Economics, University of Illinois at Urbana-Champaign, September 19, 2023.
Paulson, N., G. Schnitkey, C. Zulauf, J. Colussi and J. Baltz. "Fertilizer Prices Continue Decline and May Impact Farmers’ Nitrogen Decisions." farmdoc daily (13):150, Department of Agricultural and Consumer Economics, University of Illinois at Urbana-Champaign, August 15, 2023.
Rothenberg, Matt. “Opening Day, the Baseball Holiday.” National Baseball Hall of Fame. https://baseballhall.org/discover-more/stories/baseball-history/opening-day-the-baseball-holiday.
Schnitkey, G. "Anhydrous Ammonia, Corn, and Natural Gas Prices Over Time." farmdoc daily (6):112, Department of Agricultural and Consumer Economics, University of Illinois at Urbana-Champaign, June 14, 2016.
Schnitkey, G., N. Paulson, C. Zulauf and J. Baltz. "Fertilizer Prices and Company Profits Going into Spring 2023." farmdoc daily (13):36, Department of Agricultural and Consumer Economics, University of Illinois at Urbana-Champaign, February 28, 2023.
Schnitkey, G., N. Paulson, C. Zulauf and J. Baltz. "Nitrogen Fertilizer Prices Stabilize at High Levels in Spring 2023." farmdoc daily (13):108, Department of Agricultural and Consumer Economics, University of Illinois at Urbana-Champaign, June 13, 2023.
Schnitkey, G., N. Paulson, C. Zulauf, K. Swanson and J. Baltz. "Nitrogen Fertilizer Prices Above Expected Levels." farmdoc daily (11):165, Department of Agricultural and Consumer Economics, University of Illinois at Urbana-Champaign, December 14, 2021.
Thayer, Ernest Lawrence. “Casey at the Bat.” Poets.org. https://poets.org/poem/casey-bat.
Voigt, David Quentin. “The Boston Red Stockings: The Birth of Major League Baseball.” New England Quarterly (1970): 531-549. https://www.jstor.org/stable/363131.
Winick, Stephen. “April Fools: The Roots of an International Tradition.” Library of Congress Blogs. March 28, 2016. https://blogs.loc.gov/folklife/2016/03/april-fools/.
Disclaimer: We request all readers, electronic media and others follow our citation guidelines when re-posting articles from farmdoc daily. Guidelines are available here. The farmdoc daily website falls under University of Illinois copyright and intellectual property rights. For a detailed statement, please see the University of Illinois Copyright Information and Policies here.