


The Current Grain Farm Financial Position in a Longer-Term Perspective
The current period of low grain farm profitability is placed in a longer-run context using financial data dating back to the 1990s, made available by Illinois Farm Business Farm Management (FBFM). Overall, 2024 was the lowest income year since the 1990s. While profitability currently is low, the liquidity and solvency positions of most grain farms remained strong at the end of 2024. However, continued low profitability will result in deterioration of liquidity and solvency. There is a need to lower operating expenses relative to gross farm returns. That will happen through higher grain farm prices, lower operating expenses, or a combination of the two. If grain prices do not increase, the reduction in operating expenses will require difficult adjustments. However, the current period of low prices is unlikely to lead to a financial crisis like the one in the 1980s.
Measures of Profitability, Efficiency, Liquidity, and Solvency
We summarize measures of financial performance for grain farms enrolled in Illinois Farm Business Farm Management (FBFM) that have financial statements certified usable by Illinois FBFM staff. Grain farms are those that receive over 50% of their income from grain operations. Hence, this article focuses on grain farms. To be certified usable, an operation must be a sole proprietor, meaning that partnerships and corporations are excluded from these summaries. Excluding partnerships and corporations results in less farms being summarized in the following tables. Profitability, liquidity, and solvency trends do not materially differ for partnerships and corporations from sole proprietors. Financial statements include balance sheets, income statements, and statements of cash flow.
Select financial results for the last five years are shown in Table 1 and divided into four sets of measures: profitability, efficiency ratios, liquidity, and solvency. These measures represent the usual measures by which the financial performance of businesses is evaluated. Each set will be discussed in the following sections. For one measure in each set, data will be shown back in the 1990s. Longer histories of comparable data are not available as Illinois FBFM significantly changed its financial statements in the 1990s, introducing a much more rigorous and systematic evaluation of the total financial position based on the above four sets of measures. One impetus for these measures was the farm financial crisis of the 1980s. That crisis indicated the need to not only measure a farm’s cash flow, but also evaluate profitability, liquidity, and solvency.

Profitability
Farm operating income is a measure of profitability and equals gross farm returns minus operating, depreciation, and interest expenses. Gross farm returns include cash sales, government payments including those from commodity title programs and ad hoc programs, crop insurance receipts, and net changes in inventories and accounts receivables.
Farm operating income has been highly variable over the last five years, beginning at $170,000 per farm in 2020, moving up to $339,000 in 2022, then falling to -$15,000 per farm in 2024 (see Table 1). The increase to $339,000 in 2022 was associated with higher commodity prices that followed the Covid-19 pandemic, short supplies in South America, and were further exacerbated by the Ukraine-Russia war. Commodity prices have fallen since 2022, resulting in negative farm operating income in 2024.
Figure 1 shows farm operating income from 1991 to 2024. From 1991 to 2024, farm operating income averaged $92,000, with noticeable periods in the data. From 1991 to 2005, farm operating income averaged $45,000 per farm. Incomes then rose as ethanol use increased, boosting demand for corn, with farm operating income reaching a high in 2012 of $252,000 per farm. As commodity prices declined from 2012 highs, income fell, averaging $54,000 between 2014 and 2019 slightly above what that average from 1991 to 2005.

The last five years have seen the highest farm operating incomes of $339,000 in 2022 and the lowest of -$15,000 in 2024 over the period since 1991. The only other year in which farm operating income was negative was 2015, when it averaged -$500 per farm.
The current low-income level is concerning. Corn and soybean prices are not expected to increase substantially from current levels for the foreseeable future. Moreover, government assistance has been important to farm incomes in recent years. In 2024, gross farm returns included an end of year accounts receivable for Economic Assistance Payments that were part of the American Relief Act of 2024 (see farmdoc daily, January 7, 2025). Without those payments, 2024 farm operating incomes would have been $30,000 lower, or -$45,000 per farm.
Efficiency Ratios
Efficiency ratios have gross farm returns in their denominator. The numerators are either expense categories or farm operating income. For example, the operating expense ratio equals operating expenses divided by gross farm returns. For the three expense efficiency measures — operating, interest, and depreciation — lower values are preferred. For the operating expenses ratio, a goal of being below .60 is often used. The operating expenses ratio declined from 0.62 in 2020 to 0.58 in 2022 (see Table 1). As revenue fell in 2024, the operating ratio increased to .83, meaning that operating expenses accounted for 83% of gross farm returns.
The operating expense ratio exhibited a general trend up during the 1990s up to 2015 (see Figure 2). The operating expense ratio was 0.53 in 1992, reaching a high of 0.81 in 2015. The high in 2015 was associated with a decline in commodity prices and negative profitability. The 2024 value of .83 is the highest this ratio has been since 1990 (see farmdoc daily, April 9, 2025 for further analysis of the operating expense ratio).
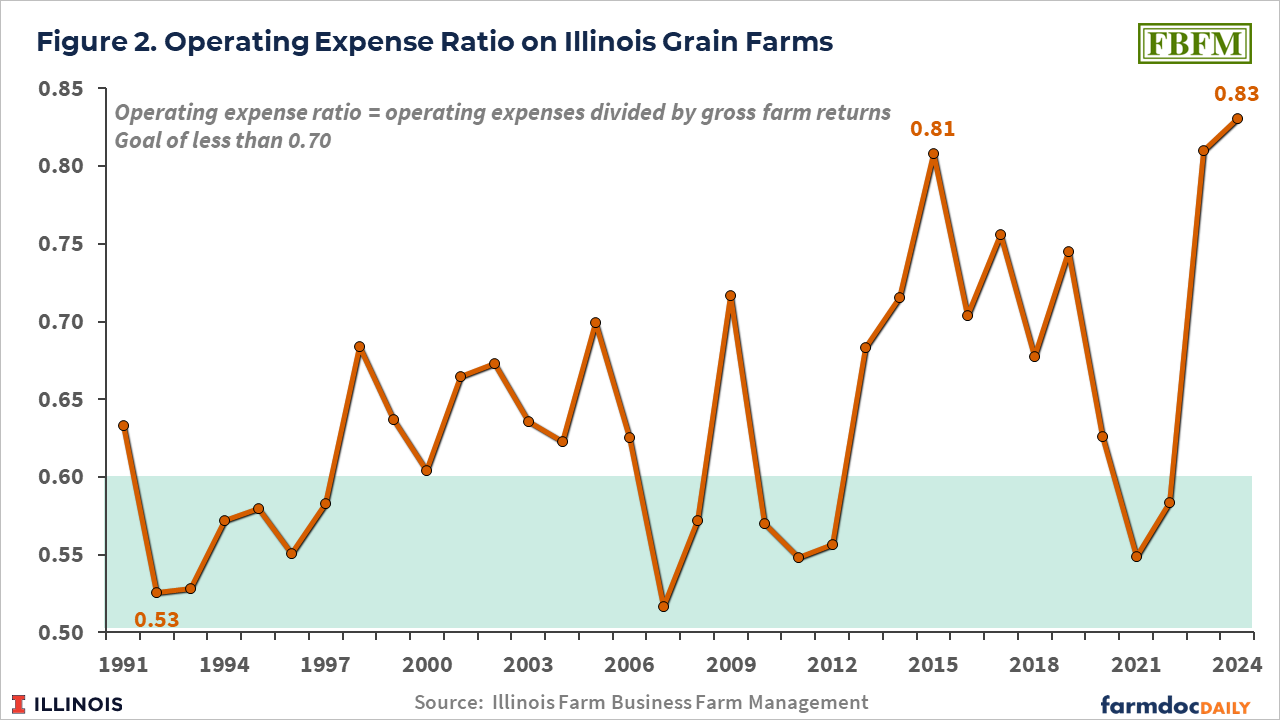
If revenues do not increase in future years, operating expenses will need to decline to reduce the operating expense ratio. A decline below 80 percent is needed, as both times when the operating expense ratio has been above .80, farm operating income has been negative.
Liquidity
Liquidity measures a farm’s ability to cover short-term debt with liquid, short-term assets. Liquidity is typically measured by:
- Working capital, which equals current assets minus current liabilities. For grain farms, large amounts of current assets are typically in cash, prepaid expenses for next year’s crops, and grain inventories. Current liabilities usually include operating loans, current portions of longer-term debt, and accrued tax liabilities.
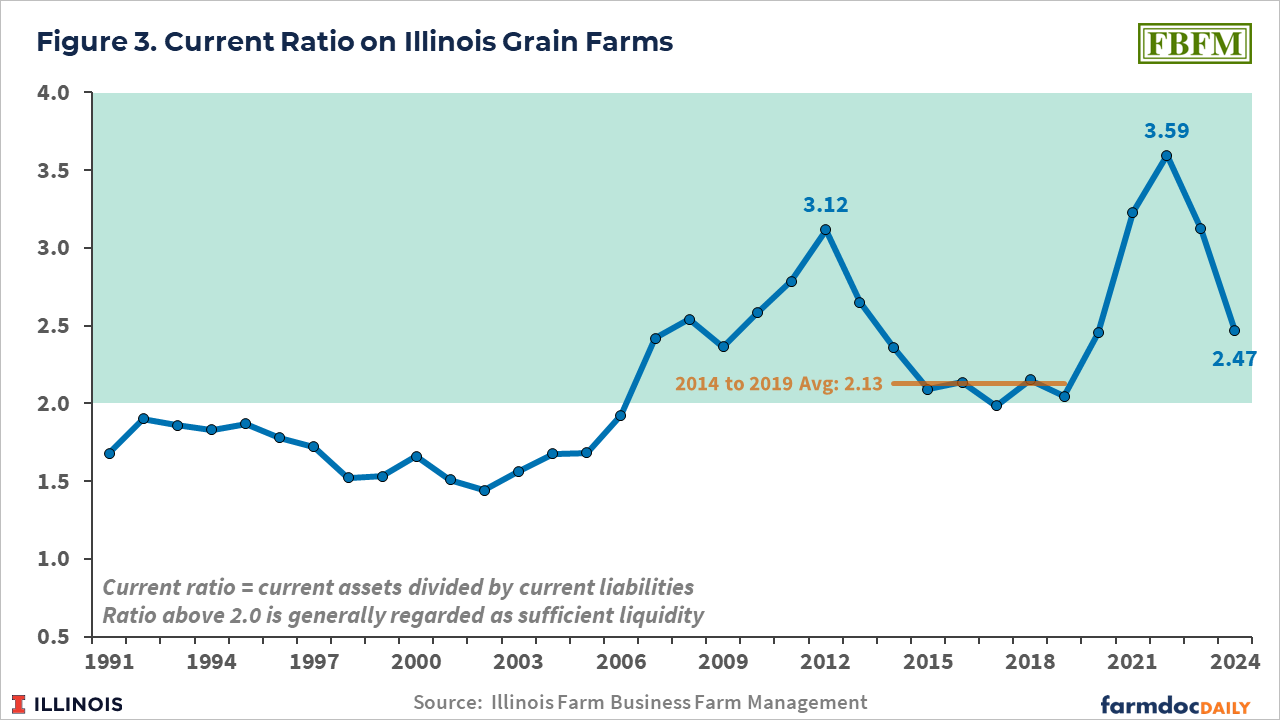
- Current ratio is current assets divided by current liabilities. The current ratio measures current assets to liabilities; a ratio above 2.0 is generally regarded as sufficient liquidity.
Liquidity provides a farm with resources to meet adverse financial results that may occur in the future, as well as funds to make any investments that become available.
Working capital reached a high of $608,000 per farm at the end of 2022 (see Table 1). That high corresponds to the record farm operating income. From the 2022 high, working capital declined to $372,000 at the end of 2024, a $236,000, or 38%, decrease. Negative profitability contributed to the decrease in liquidity.
Similarly, the current ratio has declined from 3.59 at the end of 2022 to 2.47 at the end of 2024 (see farmdoc Daily, January 9, 2025, for further analysis of the current ratio). The 3.59 value at the end of 2022 was the highest level since 1991 (see Figure 3). The previous high was in 2012 with a 3.12 value. While the ratio at the end of 2024 declined from 2022 levels, a 2.47 level still represents good liquidity and is above the 2014 to 2019 average of 2.13. However, another year of lower income in 2025 could bring the current ratio back to levels seen in 2014-2019.
Solvency
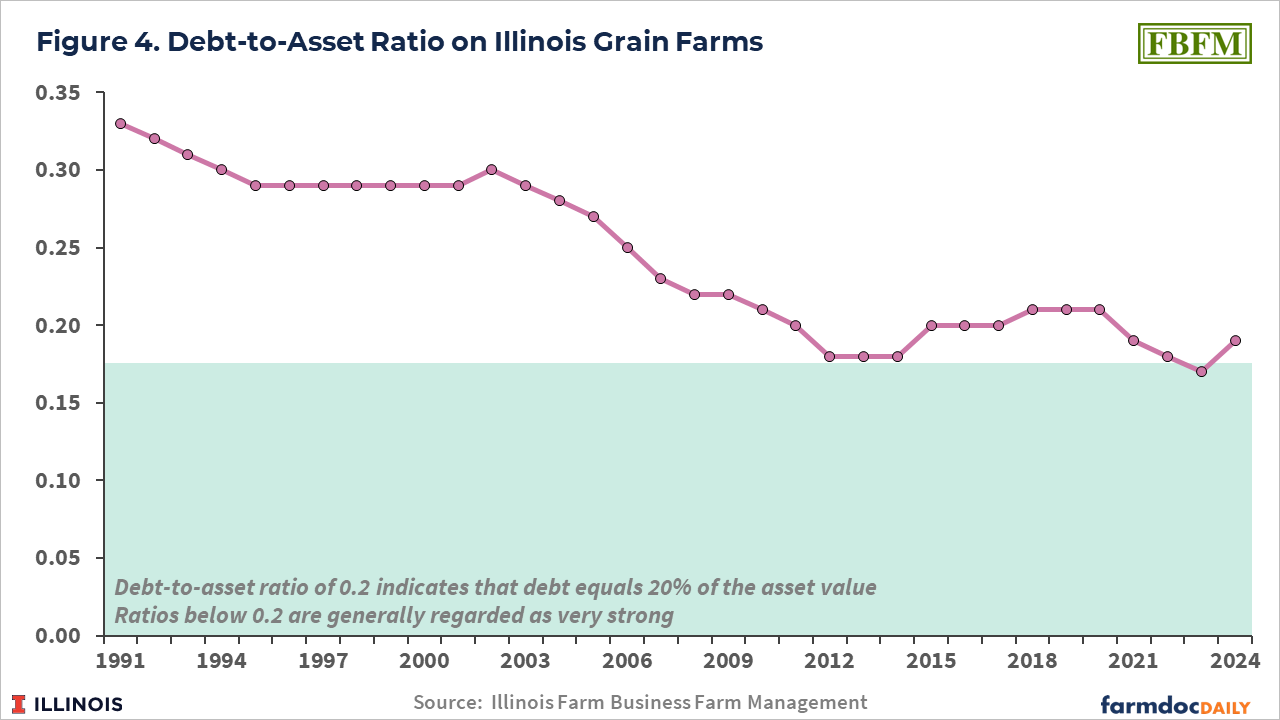
Solvency is a firm’s ability to pay all its debts with its assets. A standard measure of solvency is the debt-to-asset ratio. A debt-to-asset ratio of .2 indicates that debt equals 20% of the asset value. Debt-to-asset ratios above 1.0 mean that a firm is technically insolvent. Ratios below 0.2 are generally regarded as very strong.
Over time, the average debt-to-asset ratio has declined from 0.33 in 1991 to 0.177 in 2012 (see Figure 4). From the 2012 low, the average debt-to-assets ratio increased to .209 in 2019. From the 2019 level, the debt-to-asset ratio decreased to 0.174 at the end of 2023, then increased to 0.187 at the end of 2024. The 2024 average represents a relatively low ratio from a historical perspective, and remains in the very strong category. Still, the increase from 2023 to 2024 was the largest yearly increase since 1991.
Summary
Profitability in 2024 was negative and the lowest since 1990, when comparable data have been available from FBFM. That low profitability corresponds to very high operating expense ratios. For profitability to return to grain farms, either:
- Gross farm returns have to increase while costs remain the same. The most likely way gross returns could increase is through higher commodity prices. Continuation of ad hoc government payments could help maintain gross farm returns.
- Costs decline while gross farm returns remain the same. Cost declines would have to come from the larger cost categories, such as fertilizer, seed, pesticides, or farmland rental.
- Some combination of 1 and 2 above.
While profitability is low, the average liquidity and solvency positions remain strong. Most farms have the financial resources to withstand current low levels of profitability Still, liquidity and solvency are eroding, and this will become more troublesome if future profitability remains low.
While the average liquidity and solvency positions are strong, some farms will face difficulties as their liquidity and solvency is not as strong as the average (for some indication of variability, see farmdoc daily, October 17, 2025, and October 31, 2025). Those farmers facing greater difficulties are likely younger and have more of their land base cash-rented. As always, established farmers face fewer difficulties during periods of low profitability.
We note that ad hoc government assistance payments were a significant source of revenue in 2024 and in earlier years. Ad hoc payments likely will continue. While those payments do provide aid to farmers, they also forestall cost declines. Cash rents and input prices would be lower if those ad hoc payments had not occurred. As a result, ad hoc payments do present long-term difficulties. If those payments end without an increase in commodity prices, farm adjustment will likely be more difficult.
Invariably, questions exist whether this period is similar to the 1980s. The nature of the events that caused the 1980s financial crisis differs from the current low-profitability crunch. In the 1970s and 1980s, debt ratios were much higher on farms. Then interest rates rose substantially during the early 1980s as the Fed raised rates to combat inflation. Higher interest rates led to negative cash flows on farms. Farmland prices fell precipitously, leading to many farms becoming insolvent. In 2025, interest rates remain below levels of the 1980s, and farmland prices do not appear to be ready to experience declines like those in the 1980s.
The 1980s highlighted the need to monitor liquidity and solvency and yielded two significant outcomes. First, farmers and lenders became fundamentally more conservative in their use of debt. That can be seen by the lowering of debt-to-asset ratios through the 1990s and into the 2000s (see Figure 4). Second, the preparation of financial statements became standard in the Midwest. Tom Frey and Danny Klinefelter of the University of Illinois released their “Coordinated Financial Statements for Agriculture.” The University of Minnesota, under the leadership of Dick Hawkins, released FinPack. The Farm Financial Standards Council developed financial guidelines for agriculture. FBFM adopted a coordinated financial approach to statement preparation.
Today’s strong solvency and monitoring suggest that widespread bankruptcies in the Midwest like those in the 1980s are not likely to occur in the short- to medium-term. Instead, lenders will restrict the amount of debt funds available to farmers. That constriction will cause many farm operations to change their operating procedures by lowering costs and farmland rents. Most operations will be successful in making those changes. Others will choose to exit the farming industry before solvency erodes and net worth disappears.
References
Mashange, G., B. Zwilling and D. Raab. "The Liquidity of Illinois Grain Farms: Current Ratio." farmdoc daily (15):6, Department of Agricultural and Consumer Economics, University of Illinois at Urbana-Champaign, January 9, 2025.
Mashange, G. and B. Zwilling. "The Financial Efficiency of Illinois Grain Farms: Operating Expense Ratio." farmdoc daily (15):66, Department of Agricultural and Consumer Economics, University of Illinois at Urbana-Champaign, April 9, 2025.
Mashange, G. and B. Zwilling. "Solvency Series: Per Acre Gross Farm and Management Returns of Illinois Grain Farms by their Debt Burden." farmdoc daily (15):192, Department of Agricultural and Consumer Economics, University of Illinois at Urbana-Champaign, October 17, 2025.
Mashange, G. and B. Zwilling. "What the Numbers Say: Examining the Decline in Capital Replacement and Term Debt Repayment Margins for Illinois Grain Farms." farmdoc daily (15):201, Department of Agricultural and Consumer Economics, University of Illinois at Urbana-Champaign, October 31, 2025.
Paulson, N., G. Schnitkey, C. Zulauf and J. Coppess. "Impacts of Economic Assistance Payments." farmdoc daily (15):4, Department of Agricultural and Consumer Economics, University of Illinois at Urbana-Champaign, January 7, 2025.
Disclaimer: We request all readers, electronic media and others follow our citation guidelines when re-posting articles from farmdoc daily. Guidelines are available here. The farmdoc daily website falls under University of Illinois copyright and intellectual property rights. For a detailed statement, please see the University of Illinois Copyright Information and Policies here.