


Nitrogen Prices Remain in Focus After Iran Conflict
Operation Epic Fury began on February 28 and has focused attention on the resulting increase in energy and fertilizer prices (see farmdoc daily articles from March 17 and March 23, 2026). Today’s article revisits a simple statistical model relating anhydrous ammonia prices to corn and natural gas prices through time. Recently, average retail anhydrous ammonia prices in Illinois have approached $1,000 per ton, well above the historical average of $737 per ton. The simple model’s forecast suggests anhydrous ammonia prices will remain high into the fall, potentially creating a challenge for farmers’ early input decisions for the 2027 crop.
Anhydrous Ammonia, Corn, and Natural Gas Prices
According to the latest Illinois Production Cost Report from the USDA, average anhydrous ammonia prices reached an average of $998 per ton over the two weeks prior to March 20, 2026. That $998 price represents an increase of $155 (+18.4%) from the $843 average in the February 20th report released prior to the start of the conflict in Iran. Over the same time period, the average urea price in Illinois increased by nearly 42% from $579 per ton prior to the conflict to $823 on March 20th. Similarly, 32% liquid nitrogen solution prices increased by 31% to $570 per ton. As expected, all these prices are correlated as anhydrous ammonia is an ingredient in urea and nitrogen solutions production (farmdoc daily, February 17, 2021), and the nitrogen fertilizers act as substitutes.
As shown in other farmdoc daily articles (June 14, 2016, December 14, 2021, and June 18, 2024), average retail anhydrous ammonia prices in Illinois track both average corn and natural gas prices.
Higher corn prices are typically associated with higher anhydrous ammonia prices (see Figure 1). Corn is a major user of nitrogen fertilizers (see farmdoc daily, May 29, 2015), with higher corn prices generating higher demand. Moreover, farmers usually earn larger returns when corn prices are higher, providing more funds to pay for fertilizers and other inputs. Shown in Figure 1, prices for corn and anhydrous ammonia trended up from late-2020 to mid-2022, reaching highs above $7.00 per bushel and $1,600 per ton, respectively.
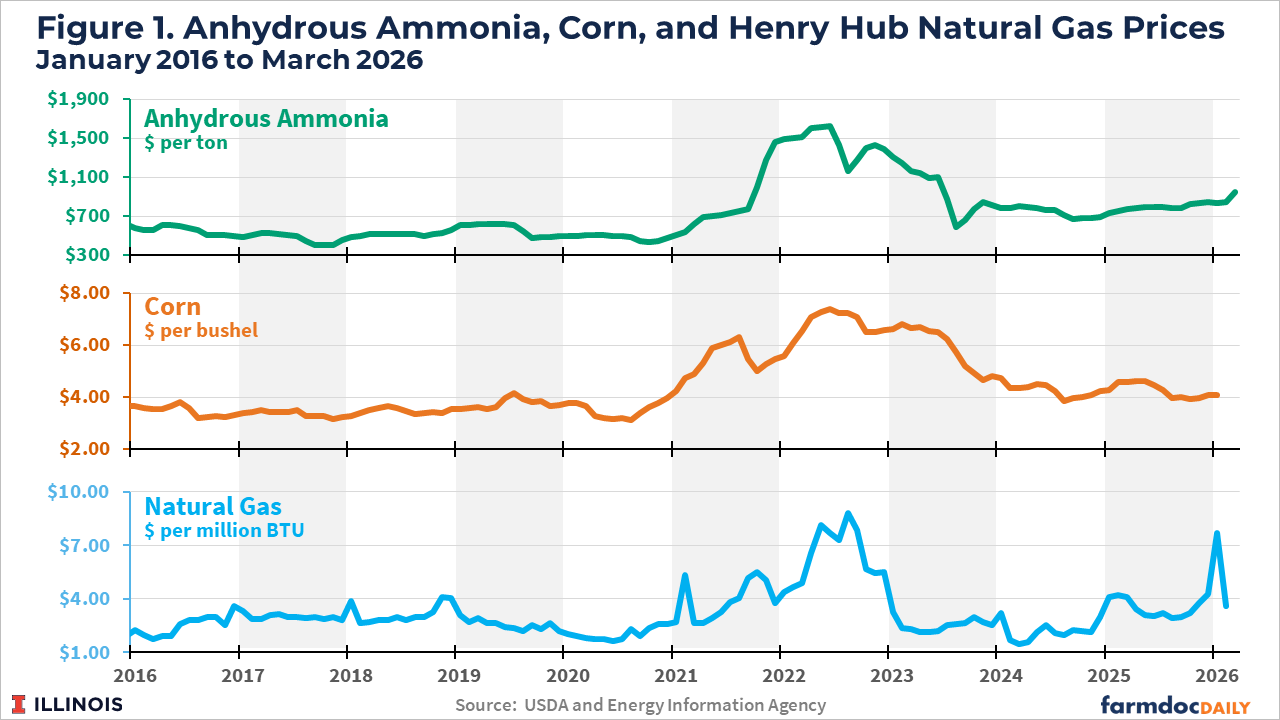
Higher natural gas prices are also typically associated with higher anhydrous ammonia prices as natural gas is a major input into the manufacture of synthetic nitrogen fertilizers. Average monthly natural gas prices also increased from late-2020 to reach highs above $8 per million BTU in mid-2022. Natural gas prices also spiked in January 2025, with the average price reaching $7.72, but returned to an average of $3.62 in February. The short-lived spike was largely attributed to the effects of Winter Storm Fern which led to supply shortages during a period of heightened winter demand.
Explaining Anhydrous Ammonia Prices
The joint impacts of corn and natural gas prices on anhydrous ammonia price can be examined using a linear regression model, similar to what we have done in the past (see farmdoc daily articles from June 14, 2016, December 14, 2021, and June 18, 2024). Monthly anhydrous ammonia prices reported for Illinois from the USDA (USDA-AMS) are related to monthly national corn prices (USDA-NASS) and natural gas prices at the Henry Hub (EIA). A lagged anhydrous ammonia price (price from the previous month) is also included in the regression. The lagged price accounts for market dynamics and lags in fertilizer price adjustments which imply persistence of price shocks. Based on data from September 2008 through January 2026, the estimated regression equation is:
Predicted Anhydrous Ammonia Price = -3.65 + 6.74*Natural Gas Price + 7.62*Corn Price + 0.92*Lagged Anhydrous Ammonia Price
As shown in Figure 2, the estimated regression has a good fit, explaining 95% of the variation in monthly anhydrous ammonia prices in Illinois (R2 = 0.95). Deviations between actual and predicted anhydrous prices, referred to as residuals in regression analysis, were largest from late 2021 to late 2023. The residuals can be thought as factors other than corn, natural gas and lagged ammonia prices that lead to ammonia prices movements. In the last three months of 2021, actual prices exceeded predicted prices by more than $200 per ton, likely because of the impacts of Hurricane Ida on supplies (see farmdoc daily article from December 14, 2021). Large positive deviations continued into 2022 with further supply chain disruptions resulting from the Ukraine-Russia conflict. Eventually, disruptions worked their way through the system, with the relationship between ammonia, corn, and natural gas prices being relatively stable during 2024 and 2025 and statistical fit resembling the earlier period.
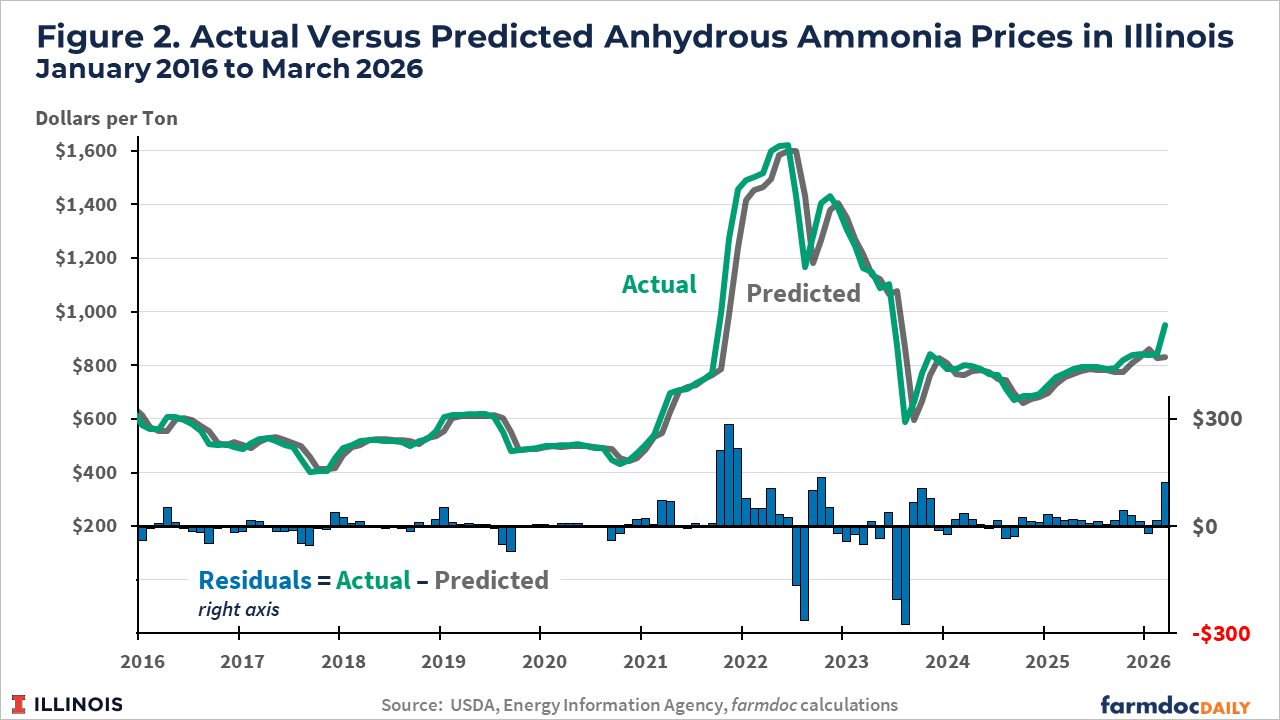
Note, however, the large positive deviation for March 2026. The average anhydrous ammonia price is $121 higher than the predicted price from the model based on corn and natural gas levels. That high deviation is likely a result of the commencement of hostilities between Iran and the U.S. and Israel. Large positive price deviations also occurred in the initial months following the start of the Ukraine-Russia conflict in February 2022.
Where to from here?
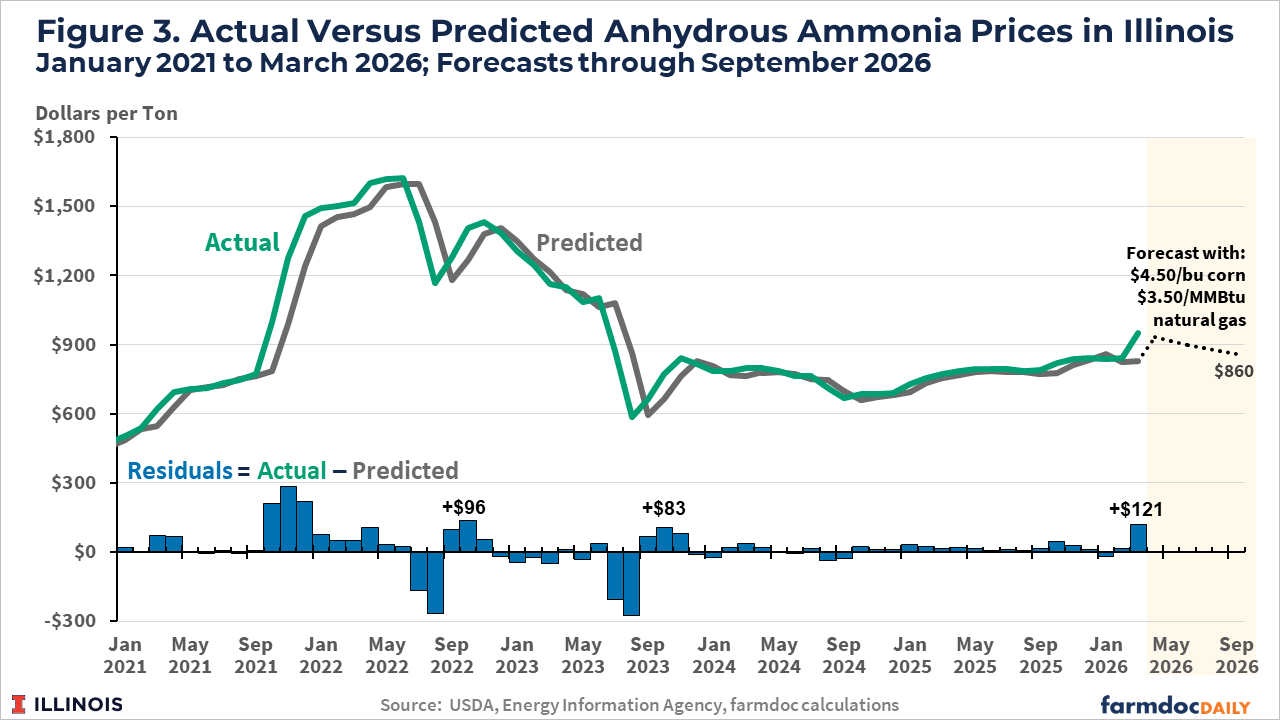
We project anhydrous ammonia prices into the fall of 2026. Fall is the typical time farmers begin purchasing nitrogen for the following year. Hence, the fall 2026 price projection reflects what farmers could face at the start of input pricing for the 2027 crop.
We use an average corn price of $4.50 for the months between now and the fall based on current futures trading and forward cash bids for fall delivery at locations in Central Illinois. Henry Hub natural gas prices are set at $3.50 per million BTU, close to the levels currently on futures contracts over the next 6 months. A $3.50 natural gas price is not particularly high and is below the $3.71 average for the previous year, suggesting that natural gas prices are largely insulated from events in the Middle East, particularly compared with crude oil and its direct derivative products gasoline and diesel fuel.
Given those prices, the anhydrous ammonia price for fall of 2026 is projected at $860 per ton (see Figure 3). That price is well above the $737 average from 2012 to the present, and also above the $779 average for 2025. Higher fertilizer prices are likely to continue even if the conflict ends soon due to the persistence in price shocks. We also note that fall 2026 prices could be much higher – exceeding $1,000 per ton – particularly if the Iran Conflict continues. This would be similar to the elevated prices that persisted into the fall months of 2022 (average residual of +$96 from September through November) and 2023 (average residual of +$83 from September through November) following the start of the Ukraine-Russia conflict.
Summary and Implications
Nitrogen fertilizer prices have increased substantially since Operation Epic Fury commenced. Those higher fertilizer prices are likely to continue into the fall. This longer-run price increase could result in a larger impact on farmer production costs and returns in 2027 than in 2026.
At that point, decision-making for the 2027 crop will present challenges. Many farmers typically purchase a portion of their nitrogen in the fall. However, high nitrogen prices could lead to shifts from historical purchasing norms, as some farmers may anticipate or hope for lower prices in the early months of 2027. Given that nitrogen fertilizers are not used intensively on soybeans, higher nitrogen prices could also lead to a shift towards more soybean acres and fewer corn acres.
References
Arita, S., R. Chakravorty, J. Kim, W. Lwin and S. Steinbach. "Strait of Hormuz Closure and Fertilizer Supply Risks for U.S. Agriculture." farmdoc daily (16):48, Department of Agricultural and Consumer Economics, University of Illinois at Urbana-Champaign, March 23, 2026.
Monaco, H., N. Paulson, and G. Schnitkey. "Trends in Fertilizer Use and Efficiency in the U.S." farmdoc daily (15):98, Department of Agricultural and Consumer Economics, University of Illinois at Urbana-Champaign, May 29, 2025.
Paulson, N., G. Schnitkey, and C. Zulauf. "Where Might Nitrogen Fertilizer Prices Be Headed?" farmdoc daily (14):114, Department of Agricultural and Consumer Economics, University of Illinois at Urbana-Champaign, June 18, 2024.
Schnitkey, G. "Anhydrous Ammonia, Corn, and Natural Gas Prices Over Time." farmdoc daily (6):112, Department of Agricultural and Consumer Economics, University of Illinois at Urbana-Champaign, June 14, 2016.
Schnitkey, G., N. Paulson, C. Zulauf, K. Swanson and J. Baltz. "Nitrogen Fertilizer Prices Above Expected Levels." farmdoc daily (11):165, Department of Agricultural and Consumer Economics, University of Illinois at Urbana-Champaign, December 14, 2021.
Schnitkey, G., C. Zulauf, N. Paulson and J. Baltz. "The Iran Conflict: Potential Impacts on 2026 Corn and Soybean Returns." farmdoc daily (16):45, Department of Agricultural and Consumer Economics, University of Illinois at Urbana-Champaign, March 17, 2026.
Sellars, S. and V. Nunes. "Synthetic Nitrogen Fertilizer in the U.S." farmdoc daily (11):24, Department of Agricultural and Consumer Economics, University of Illinois at Urbana-Champaign, February 17, 2021.
Disclaimer: We request all readers, electronic media and others follow our citation guidelines when re-posting articles from farmdoc daily. Guidelines are available here. The farmdoc daily website falls under University of Illinois copyright and intellectual property rights. For a detailed statement, please see the University of Illinois Copyright Information and Policies here.