


Burdensome Grain & Oilseed Stocks?
Despite frequent headlines of burdensome grain & oilseed stocks, they are normal when measured appropriately. The important storyline is that stocks have not increased relative to use even though world yield of grains & oilseeds has been at or above trend since 2012. Stocks are not the reason prices and return are low. An intriguing hypothesis is that prices and returns are low because the current market is “priced to perfection,” where perfection means the market currently anticipates a lower-than-normal probability that world grain & oilseed yield in 2026 will fall below trend. If this hypothesis is correct, any shortfall in 2026 yield below trend in any of the world’s major production areas will likely send prices higher to ration supply across current demand momentum. The preceding does not mean prices and returns will be higher come 2026 harvest. If 2026 world yields exceed trend, even by a small margin, prices and returns will remain low.
Measuring Stocks Appropriately: Stock-Use Ratio
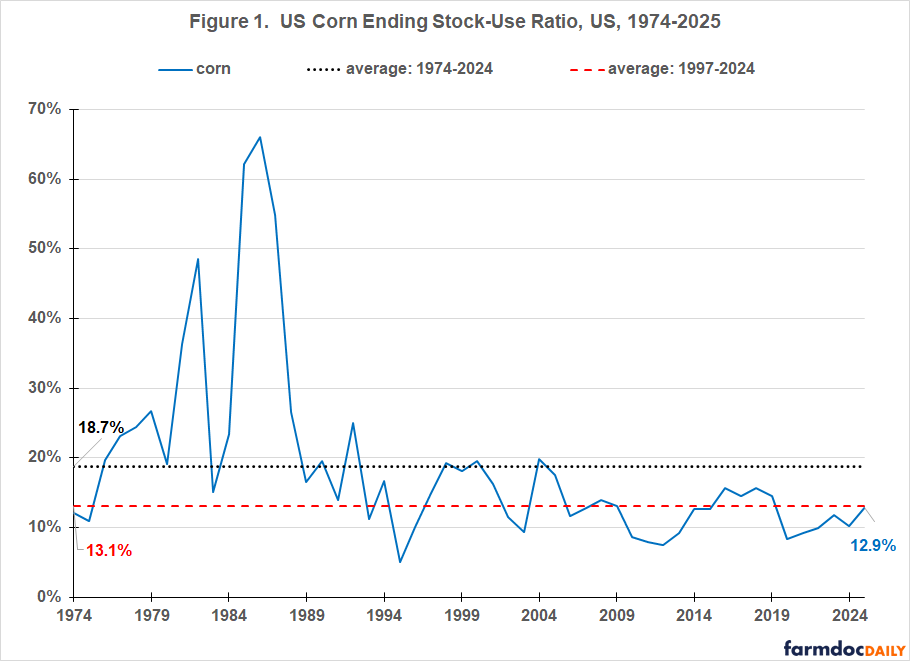
US corn stocks at the end of the 2025 crop year are currently estimated at 2.1 billion bushels. 2.1 billion bushels means one thing when use is 4.6 billion bushels, as it was in 1974. It means something else when use is 16.5 billion bushels, the current projection for 2025. 2.1 billion bushels is nearly half of 1974 US use of corn (domestic consumption plus exports). That would be burdensome by any measure. In 2025, 2.1 billion bushels is only 13% of US use. Stocks need to be measured relative to use.
US estimated 2025 corn ending stock-to–use ratio is 12.9% (see Figure 1). This is notably below the average ratio since 1974 (18.7%) and nearly identical to the average since 1997 (13.1%), the year after the 1996 farm bill eliminated most US public stock programs. Current US corn stock-use ratio is not burdensome even though it is notably higher than for 2024 (10.3%). Comparing only to last year is too narrow and potentially deceiving. Figure 1 and all other figures in this article use data from PSD (Production, Supply, and Distribution), a USDA, FAS (US Department of Agriculture, Foreign Agriculture Service) database.
Measuring Stocks Appropriately: World Stock-Use Ratio
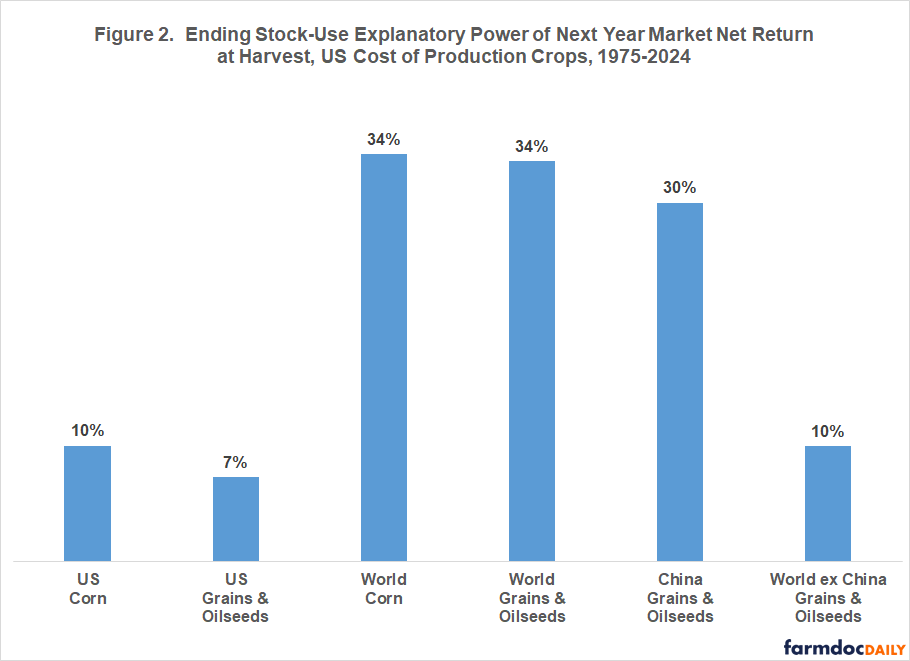
Markets track stocks because they provide insights into the balance between supply and demand, which affects prices and return. The higher is stock-use ratio, the lower are price and return, other factors the same. Figure 2 thus presents explanatory power of the relationship between various stock-use ratios and collective US net return to the economic cost of producing barley, corn, cotton, oats, peanuts, rice, sorghum, soybeans, and wheat as computed by USDA, ERS (Economic Research Service). For a discussion of how the USDA, ERS data is used to compute collective net return, see the farmdoc daily of April 11, 2025, especially the data notes.
In Figure 2, a higher explanatory power implies this year’s stock-use ratio provides a better indication of next year’s collective net return to producing the nine field crops. Explanatory power is clearly higher for world than US stock-use ratios. Using a multiple variable analysis involving stock-use and other variables, the farmdoc daily of January 7, 2026 reached the same conclusion.
Historical and Current World Stock-Use Ratios
Explanatory power is the same for world corn and world grain & oilseed stock-use ratio. A close relationship exists between changes in the two ratios (see Figure 3). Changes in world corn stock-use ratio explains 74% of changes in world grain & oilseed stock-use ratio. Besides corn, grains & oilseeds are barley, cottonseed, millet, mixed grains, oats, peanuts, rapeseed (canola), rice (milled), rye, sorghum, soybeans, sunflower seed, and wheat. It is useful to examine these crops collectively because they are substitutes and complements in consumption and compete for acres and storage space.
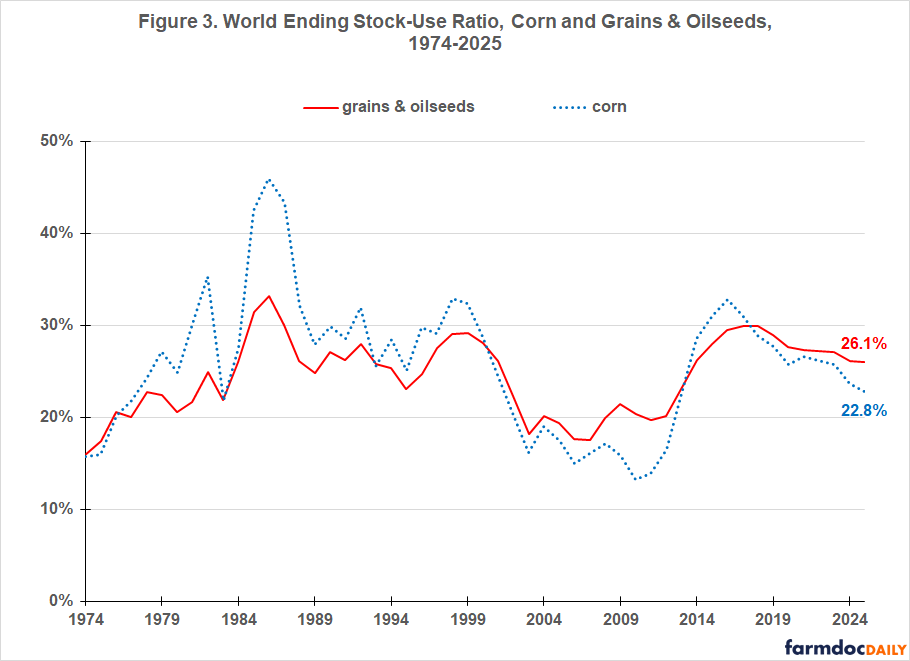
Current estimate of 2025 world corn stock-use ratio (22.8%) is below its longer-term averages of 25.8% since 1974 and 23.5% since 1997. However, the current estimate of 2025 world grain & oilseed stock-use ratio (26.1%) is above its averages of 24.5% since 1974 and 24.6% since 1997. Both stock-use ratios have been working their way lower since 2017.
Historical and Current China Stock-Use Ratios
Figure 4 also highlights the role of stocks held by China. It is important to first note that it is commonly accepted that more than normal uncertainty surrounds the size of China’s stocks of grains & oilseeds, both currently and historically. Assuming the PSD data is acceptably accurate, China currently holds 49.0% of world stocks of grains & oilseeds. This share exceeds their average shares of 43.4% since 1974 and 45.4% since 1997. China’s grain & oilseed stock-use ratio has been declining since 2017 when it was 69.5%.
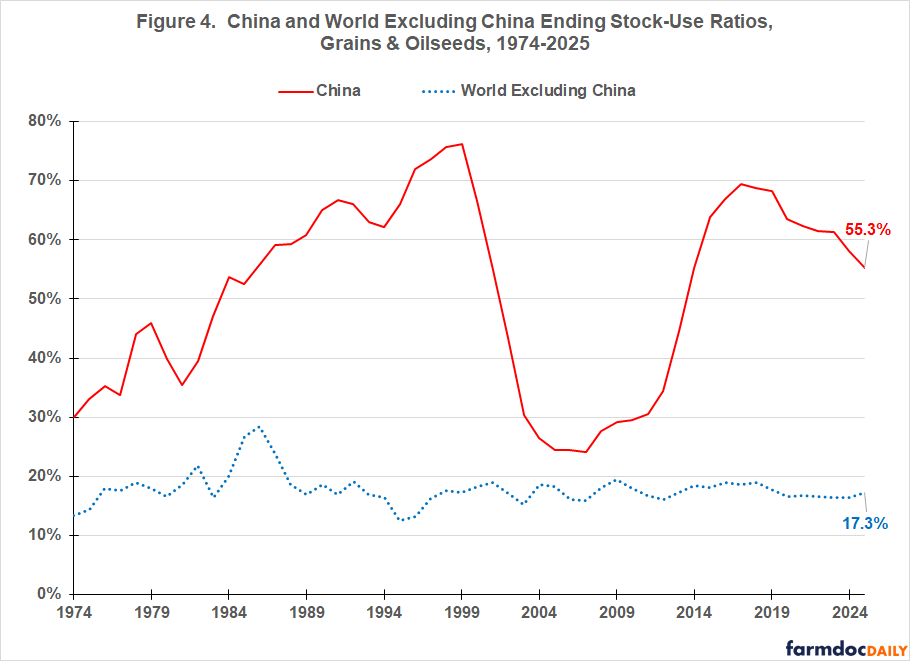
China’s high stock-use ratio reflects in part a two millennial plus concern with peasant revolutions ignited by food shortages. China is now rich enough to hold large buffer stocks, which are reinforced by its need for large imports of farm products. While important to track the size and direction of change in China’s grain & oilseed stock-use ratio, it is also important to understand that China will likely always hold large stocks. To illustrate this point, in only 5 of the last 52 years has China’s grain & oilseed stock-use ratio been below the highest ratio observed for the rest of the world (28.3% in 1986).
For the world excluding China, grain & oilseed stock-use ratio has varied only from 15.1% to 19.5% since 1997 and even less over the last 10 years (16.5% to 18.9%). The average since 1997 is 17.4%, nearly identical to the 2025 stock-use ratio of 17.3%.
In examining Figures 3 and 4, it is important to note that world and China grain & oilseed stock-use was low for several years before the 2007-2013 period of field crop prosperity. They continued to be low during the early years of this prosperity period. The reasons for raising this observation are (1) low stocks-use ratios can be associated with low returns, a historically observed fact that is often overlooked; and (2) high returns usually require at least one other factor beyond low stock-use ratios, such as below trend world yields and shocks from policy changes or other non-production factors.
Assessment
The preceding examination of various world, US and China grain & oilseed stock-use ratios suggests stocks are normal, maybe slightly above normal. They certainly are not burdensome.
The more important storyline is no increase in stock-use ratios over 10 or so years. Demand has grown as fast as supply, signaling demand momentum and a building demand market.
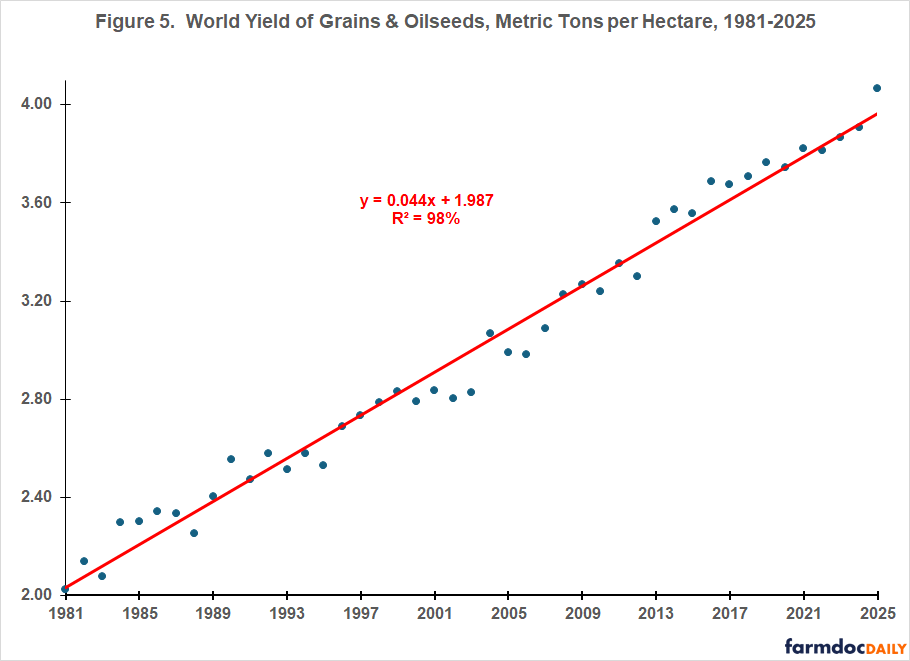
If stocks are not burdensome, why are current market prices and returns so low? There are likely several reasons, but Figure 5 provides an intriguing hypothesis: Are grain and oilseed markets currently “priced to perfection” where perfection means they are anticipating a lower-than-normal likelihood that world yield of grains and oilseeds will be below trend in 2026 (perhaps even further into the future). Support for raising this hypothesis is that, since 2012, collective world grain & oilseed yield has been at or above trend. From the perspective of world supply, no agro-climate disruption has occurred for now 13 years.
If the hypothesis is correct, any shortfall in 2026 yield below trend in any of the world’s major production areas will likely send prices higher to ration supply across current demand momentum. However, “Yield always trumps all pricing factors.” If the world’s major production areas have trend or above yields in 2026, grain & oilseed prices will remain low.
The key question is, “Why has world yield variability relative to trend been so low since 2012?” If due to crop genetics and/or production practices, the immediate past will more likely than not be the normal going forward.
The implication of even raising this question and the associated hypothesis for farm management is that farms must be prepared financially to sustain themselves for multiple-year downturns in prices and revenue. Managing a farm so it has financial sustainability for only one or two stress years is poor management.
Crop safety net policy also needs to adjust. Providing continuous aid will only encourage poor management. “The market always wins.” Forestalling the removal of poor management only makes the eventual resolution more expensive for farmers, landowners, and the government.
Figure 5 also raises questions about foundational principles underpinning most discussions surrounding climate change and farming. Specifically, that climate change will cause yield growth to decline and become more variable. This may occur in local areas, but the evidence in Figure 5 is that it has not happened so far at the world market level, which is the market level that matters as long as trade in food and farm products is relatively free. For more discussion of this issue, see the farmdoc daily of December 6, 2023 and December 13, 2023 farmdoc daily.
References and Data Sources
US Department of Agriculture, Economic Research Service. December 2025. Cost of Production. https://www.ers.usda.gov/data-products/commodity-costs-and-returns/
US Department of Agriculture, Foreign Agriculture Service. March 2025. PS&D: Production, Supply, and Demand. https://apps.fas.usda.gov/psdonline/app/index.html#/app/home
Zulauf, C., J. Coppess, G. Schnitkey and N. Paulson. “Demise of the US Countercyclical Crop Safety Net.” farmdoc daily (15):68, Department of Agricultural and Consumer Economics, University of Illinois at Urbana-Champaign, April 11, 2025.
Zulauf, C., G. Schnitkey, J. Colussi and N. Paulson. “Variability of World and Regional Yields in an Era of Climate Change.” farmdoc daily (13):226, Department of Agricultural and Consumer Economics, University of Illinois at Urbana-Champaign, December 13, 2023.
Zulauf, C., G. Schnitkey, N. Paulson and J. Colussi. “World and Regional Trend Crop Yields in an Era of Climate Change.” farmdoc daily (13):221, Department of Agricultural and Consumer Economics, University of Illinois at Urbana-Champaign, December 6, 2023.
Disclaimer: We request all readers, electronic media and others follow our citation guidelines when re-posting articles from farmdoc daily. Guidelines are available here. The farmdoc daily website falls under University of Illinois copyright and intellectual property rights. For a detailed statement, please see the University of Illinois Copyright Information and Policies here.