


Comparing Current and 1970 Farm Prosperity: China and the Current Prosperity
Overview
This post is the seventh in a series that compares the current and 1970 periods of farm prosperity. Unlike the previous posts, this post largely focuses on the current period. It specifically focuses on assessing the growth in Chinese demand, both from historical and future perspectives. Previous posts in this series are available here, here, here, here, here, and here.
Background
Perhaps the only common causative factor associated with periods of U.S. farm prosperity since 1900 is the role of exports. World War I and II led to farm prosperity in the U.S. as it exported food to its allies and subsequently to war-ravaged countries. A key causative factor in the 1970 period of prosperity was the Soviet Union’s decision to import agricultural products for its consumers. Exports have played a key role in the current period of prosperity, with China being the most prominent importer. Notably, China has expanded its imports of oilseeds, principally soybeans. Expressed as the number of acres calculated using average U.S. yield per planted acre for 2008-2012 (41.2 bushels per acre), China’s soybean imports from the rest of the world grew from 11.8 to 52.8 million acres between crop years 2000/2001 and 2011/2012. Magnitude of this growth reflects China’s rapid economic growth interacting with a population of approximately 1.4 billion in 2011.
Analysis
The data for this post come primarily from 2 sources: (1) the United Nations, Food and Agriculture Organization (FAO) FAOSTAT database, available here, and (2) the International Monetary Fund (IMF) World Economic Outlook Database website, available here. FAO is the source for data on food consumption and population. IMF is the source for data on gross domestic product. The analysis uses data from 1980 and 2009 — 1980 is the first year that IMF reports data on GDP while 2009 is the last year for which data on food consumption is available. Also, 1980 is close to the beginning of China’s transformation from a communist to a more market-oriented economy.
The Food Transition
A simple measure of economic development is income per person. As income per person increases, a broad, commonly-observed transition in food consumption occurs. Key features of this food transition are increased caloric intake, increased consumption of animal protein, and increased consumption of vegetable oils, principally for cooking.
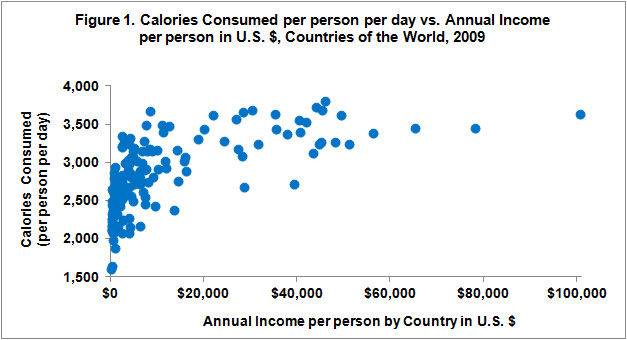
Although the food transition is tied to economic development and thus to the passage of time, its features can be illustrated with a cross-sectional picture of food consumption at a point of time, where the cross section is by country. Figures 1 through 3 contain this cross-sectional picture for 2009 for the consumption attributes examined in this post. A country’s per person income is measured using its GDP measured in current prices and 2009 U.S. dollars.
Caloric intake (see Figure 1) and consumption of animal protein (see Figure 2) increase as per person income increases. However, the relationship does not continuously increase. In 2009, total caloric intake appears to plateau around 3,500 per day while total animal protein consumed appears to plateau around 65 grams per day. The relationships depicted in Figures 1 and 2 are referred to as logarithmic. The correlation with the logarithm of income per person is +0.79 for calories and +0.88 for animal protein. These are high correlations (+1.0 is a perfect correlation).

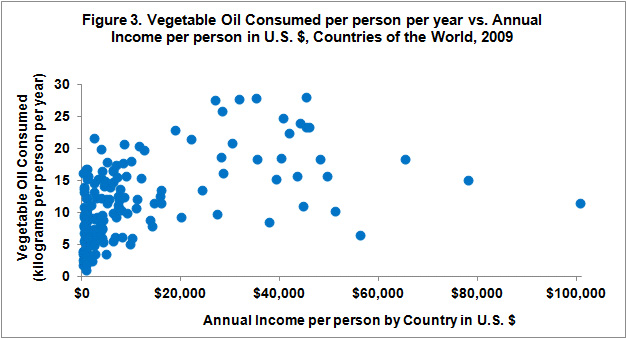
Vegetable oil consumption (see Figure 3) is also positively related to a country’s income per person. However, it is less clear if a plateau exists; especially if the three countries with the highest income per person are removed from the data. The correlation between income per person and vegetable oil consumption in 2009 is between +.49 and +0.61, depending on how the correlation is calculated.
A plateau indicates an upper limit, but a plateau may change over time. For example, in 1980, the plateaus were around 3,200 calories per day and 60 grams of protein per day. Thus, between 1980 and 2009, the plateau increased by 9% for calories and 8% for animal protein.
Food consumption plateaus are associated with what economists call Engel’s Law. It states that, as income increases, a smaller share of a person’s budget is spent on food. However, the graph for vegetable oil suggests plateaus are less clear for individual foods than for broader food categories.
China’s Food Transition
China’s food transition since 1980 is examined by comparing its consumption of food with the consumption of food by the 10 countries with the highest income per person. In 1980, China’s caloric intake was 68% of the caloric intake of the 10 counties with the highest income per person (see Figure 4). By 2009, this ratio had increased to 87%. Compared with 1980, China was 61% of the way toward being on par with the caloric intake of the 10 countries with the highest income per person [(87%-68%) / (100%-68%)].
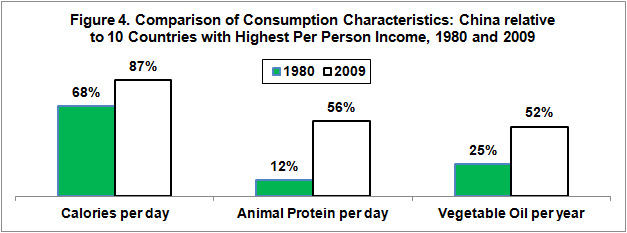
Between 1980 and 2009, China’s consumption of protein from meat and animal products increased from 12% to 56% of the consumption of animal protein by the 10 countries with the highest income per person. Thus, compared with 1980, China in 2009 was halfway to parity with animal protein consumption by the 10 countries with the highest income per person.
Between 1980 and 2009, China’s per person consumption of vegetable oil increased from 25% to 52% of the consumption in the 10 countries with the highest per person income. Thus, despite an increase in vegetable oil consumption from 3.2 to 8.9 kilograms per person per year between 1980 and 2009, China’s consumption of vegetable oil only slightly exceeds half the average consumption in the 10 countries with the highest income per person. A key reason was a 30% increase in the consumption of vegetable oil per person by the 10 countries with the highest income per person.
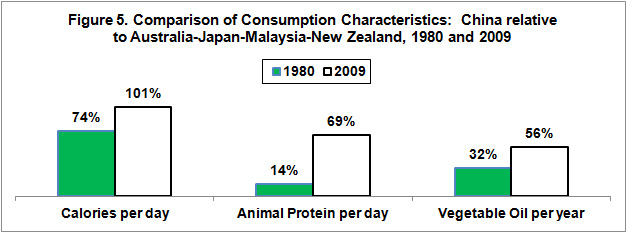
A key consideration is the appropriate benchmark by which to gauge China’s food transition. To illustrate, Figure 5 uses Australia, Japan, Malaysia, and New Zealand as the benchmark. These four countries had higher per person income in 2009 than China and are located in the Asian and Oceana geographical area. None of these countries was among the 10 countries with the highest income per person in 1980 and only Australia was among the 10 countries with the highest income per person in 2009 (it ranked tenth). China’s consumption in 2009 is closer to these four countries than the 10 countries with highest income per person, particularly for calories and animal protein. In fact, China is on par with the average caloric intake of Australia, Japan, Malaysia, and New Zealand.
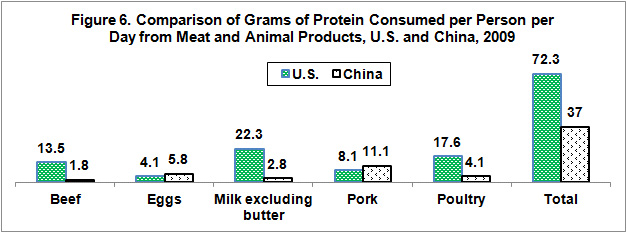
Consumption of food is based on tastes and preferences as well as biological need. To underscore the importance of taste and preferences and the need to look at both broad and individual food categories, Figure 6 presents per person consumption of various sources of animal protein in China and the U.S. The average person in the U.S. consumes nearly twice as much protein per day from meat and animal products as the average person in China. However, the average person in China consumes more protein from pork and eggs than does the average person in the U.S. The reverse exists for beef, milk products, and poultry.
Summary Observations
China’s increased demand for food has been a key driver of the current period of farm prosperity. China’s food transition has likely passed the halfway mark, but China will still need increased imports of food, particularly if its growth in production does not continue or even accelerate. However China’s food transition is likely leaving the era of a broad increase in demand across all categories of food to a more selective growth in demand focused on certain products. For example, China’s demand for animal protein will continue to increase but dairy products, beef, and poultry may account for a larger share of this increase going forward. In fact, because of differences in feed efficiency, China could probably increase animal protein consumption within increasing imports of feed ingredients by shifting production from pork to poultry and dairy products.
Because China is likely entering the second half of its food transition, China’s demand for food imports will likely grow slower in the future. Moreover, China’s population will likely peak sometime between 2025 and 2030, then begin a slow decline. Also, many observers believe China’s economy is unlikely to grow faster than 7% to 8% per year and may grow slower. In contrast, between 2005 and 2012, China’s economy grew at an average annual inflation-adjusted rate of 10.5% per year. While it seems likely China will remain a large and growing consumer of food, China’s slower growth in demand for food could lead to a downward pressure on prices whenever world production of farm products is not disrupted by weather or other factors.
The next post in this series will examine the demand for biofuels.
This publication is also available at http://aede.osu.edu/publications.
Disclaimer: We request all readers, electronic media and others follow our citation guidelines when re-posting articles from farmdoc daily. Guidelines are available here. The farmdoc daily website falls under University of Illinois copyright and intellectual property rights. For a detailed statement, please see the University of Illinois Copyright Information and Policies here.