The Profitability of Biodiesel Production in 2014
A farmdoc daily article last fall (October 30, 2014) indicated that 2014 was shaping up to be a very tough year for biodiesel producers. Since that article was published there have been some major developments such as the collapse in crude oil prices and reinstatement of the biodiesel tax credit. The purpose of this article is to provide a full-year review of biodiesel production profitability in 2014.
As in earlier farmdoc daily articles (September 18, 2013; September 25, 2013; March 19, 2014; October 30, 2014) a model of a representative Iowa plant is used to assess biodiesel production profitability. The model incorporates several key assumptions:
- 30 million gallon annual biodiesel production capacity
- Plant construction cost of $1.57 per gallon of nameplate capacity
- 50 percent debt and 50 percent equity financing
- 8.25 percent interest on 10-year loan for debt financing
- Plant operates at 100 percent of nameplate capacity
- Plant only processes soybean oil into biodiesel
- Conversion factor of 7.55 pounds of soybean oil per gallon of biodiesel
- 0.9 pounds of glycerin co-product per gallon of biodiesel
- 7 cubic feet of natural gas per gallon of biodiesel
- 0.71 pounds of methanol per gallon of biodiesel
- Other variable input costs of 25 cents per gallon of biodiesel
- Total fixed costs of 26 cents per gallon of biodiesel
This model is meant to be representative of an “average” plant constructed since 2006 to process soybean oil into biodiesel. There is certainly substantial variation in capacity, production efficiency, and feedstock across the industry and this should be kept in mind when viewing profit estimates from the model. However, limiting the feedstock to soybean oil is reasonable since it represents over half of the feedstock used to produce biodiesel in the U.S. and feedstock prices tend to be highly correlated.
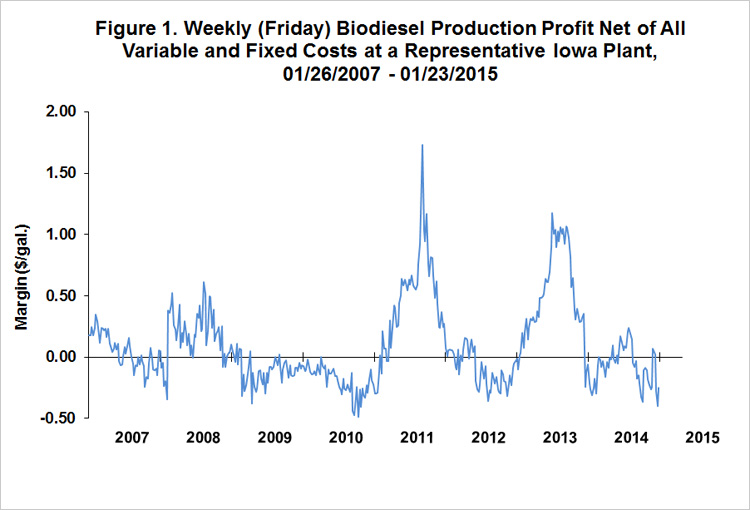
To track plant profitability over time, weekly biodiesel and soybean oil prices at Iowa plants from the Agricultural Marketing Service (AMS) were collected starting in 2007. Natural gas costs through 2013 are estimated based on monthly data from the Energy Information Agency (EIA). Due to a change in the EIA price series, natural gas costs are estimated as one percent of the nearby NYMEX natural gas futures price starting in January 2014. Glycerin and methanol prices were obtained from OPIS. Figure 1 presents the (pre-tax) estimates of biodiesel profits based on the prices and model assumptions. It is obvious from the chart that profits were indeed hard to come by in 2014 for biodiesel producers. There was a period of profits in July and August and a very brief spike in profits after the tax credit was reinstated in mid-December. But, otherwise, small to moderate losses dominated. The average weekly loss in 2014 is $-0.08 per gallon. The largest losses, over $-0.30 per gallon, occurred in February and October.

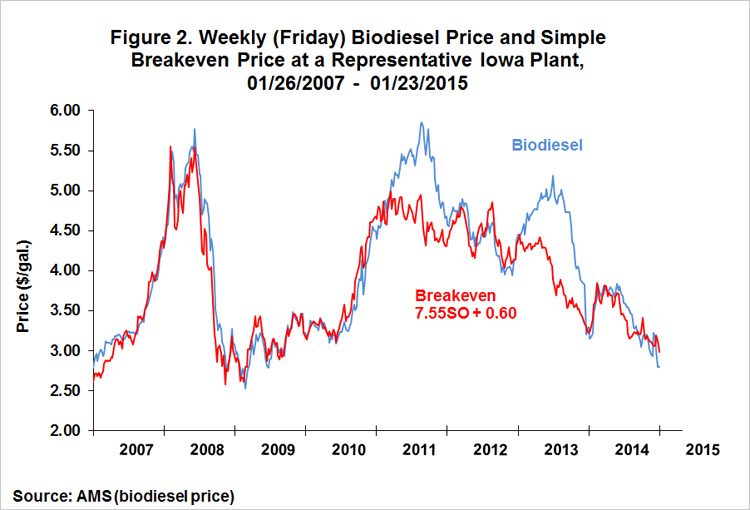
Additional insight about biodiesel profits is provided by Figure 2. Here, the biodiesel price at Iowa plants is plotted versus a simplified breakeven profit relationship between soybean oil and biodiesel prices. Since soybean oil represents over 80 percent of the variable operating costs of the representative plant, all other costs are lumped into the constant term of 0.60, or 60 cents per gallon of biodiesel produced. The 7.55 slope is just the number of pounds of soybean oil required to produce a gallon of biodiesel. One can readily observe that the line for the breakeven relationship tracks the biodiesel price very closely except for two major spikes in 2011 and 2013. In other words, outside of the two spikes, the market has generally priced biodiesel based on the cost of soybean oil, a markup for other variable and fixed costs, and zero profits. I have argued in earlier farmdoc daily articles (e.g., March 19, 2014) that biodiesel prices were pushed up substantially above breakeven levels within the two spikes as diesel blenders raced to take advantage of the blenders tax credit before it expired and engaged in discretionary blending to build stocks of biodiesel RINs.

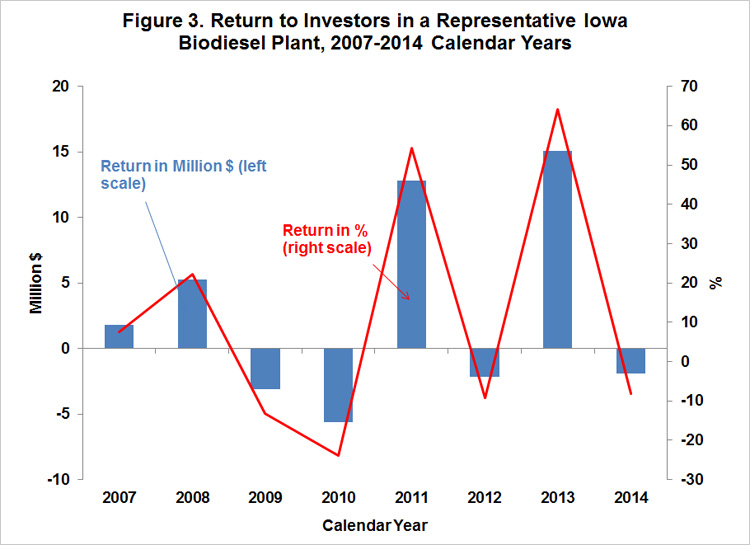
Finally, it is helpful to aggregate the profit margins over an annual horizon in order to see broader trends in estimated biodiesel production profits. Figure 3 shows total annual (pre-tax) profits net of variable and fixed costs for each calendar year between 2007 and 2014. Profits are presented in terms of both total dollar returns to equity holders and percent return to equity. The total loss in 2014 was $-1.9 million, or -8.2 percent. While this is little consolation to biodiesel producers, the 2014 loss was the smallest of the four losing years since 2007. Returns to equity holders over 2007-2014 averaged a respectable 11.8 percent despite the loss in 2014. This average masks the fact that just two years, 2011 and 2013, accounted for nearly all of the profits over this period.

Implications
2014 continued the feast or famine pattern of biodiesel production profits that is closely tied to policy incentives. With the right conditions, policy can incentivize substantial profits, as in 2011 and 2013. The tendency towards losses in other years, like 2014, can be traced to two factors (farmdoc daily, October 30, 2014). First, without policy incentives via tax credits and/or RFS mandates, there is no market for biodiesel in the U.S. because biodiesel production costs exceed the price of petroleum diesel. Second, the U.S. biodiesel production industry is over-built and there is ample slack capacity that can be drawn upon as needed. While the biodiesel industry experienced the famine part of the “feast or famine” profit cycle in 2014, the outlook for 2015 is not entirely bleak. The reinstatement of the biodiesel tax credit late in 2014 indicates the tax credit has some chance of coming back in 2015. Most importantly, there is the prospect for a substantial boom in biodiesel production and profits if the RFS renewable mandate is returned to statutory levels.
References
Irwin, S. "2014: A Tough Year for Biodiesel Producers." farmdoc daily (4):210, Department of Agricultural and Consumer Economics, University of Illinois at Urbana-Champaign, October 30, 2014.
Irwin, S. "Recent Trends in the Profitability of Biodiesel Production." farmdoc daily (4):51, Department of Agricultural and Consumer Economics, University of Illinois at Urbana-Champaign, March 19, 2014.
Irwin, S. "Biodiesel Supply Response to Production Profits." farmdoc daily (3):182, Department of Agricultural and Consumer Economics, University of Illinois at Urbana-Champaign, September 25, 2013.
Irwin, S., and D. Good. "Recent Trends in Biodiesel Prices and Production Profits." farmdoc daily (3):177, Department of Agricultural and Consumer Economics, University of Illinois at Urbana-Champaign, September 18, 2013.
Disclaimer: We request all readers, electronic media and others follow our citation guidelines when re-posting articles from farmdoc daily. Guidelines are available here. The farmdoc daily website falls under University of Illinois copyright and intellectual property rights. For a detailed statement, please see the University of Illinois Copyright Information and Policies here.


