


Ethanol Demand Destruction 2.0?
In a farmdoc daily article last week (January 29, 2025), we examined a range of alternative scenarios for setting the 2026 mandates under the U.S. Renewable Fuel Standard (RFS). In two of the scenarios, the conventional mandate was assumed to be written down to the level of domestic ethanol consumption, projected to be 14.3 billion gallons. This reflected the long-held goal of the crude oil refining industry of setting the RFS conventional (ethanol) mandate near or below the E10 blend wall (e.g., farmdoc daily, July 12, 2018). The first Trump Administration was supportive of this goal, mainly using small refinery exemptions (SREs) under the RFS. Since a second Trump Administration is now in place, it seems reasonable to assume there is the possibility of the conventional mandate again being written down, either directly or indirectly through SREs. This raises the question of the likely impact of any future reductions in the conventional mandate on the demand for ethanol in the physical market. Fortunately, the previous episode with SREs provides a valuable test case regarding the potential for ethanol “demand destruction.” The purpose of this article is to investigate the impact of SREs on the physical demand for ethanol during the first Trump Administration to better understand potential impacts if the second Trump Administration follows suit.
Analysis
The RFS was created under the Energy Policy Act of 2005 and was later modified and expanded under The Energy Independence and Security Act of 2007 (farmdoc daily, May 17, 2023). The 2005 version of the program is known as “RFS1” and the 2007 version as “RFS2.” Since its inception, the program has been administered by the U.S. Environmental Protection Agency (EPA). RFS1 included a provision to exempt small refineries (fewer than 75,000 barrels of average aggregate daily crude oil throughput) from the specified biofuel mandates based upon a finding of a disproportionate economic hardship for the small refinery (or refiner), and this provision was not changed in RFS2. The implementation of small refinery exemptions (SREs) changed substantially over time. Initially, RFS1 provided a statutory blanket exemption for all small refiners through 2010. In 2011, EPA temporarily extended the blanket exemption through 2012 in response to demands from Congress for a reassessment of the impacts on small refineries (farmdoc daily, December 6, 2017). From 2013 through 2016, the Obama Administration awarded only a few SREs. This policy was reversed in 2017 by the first Trump Administration, with the EPA granting a total of 85 SREs for the 2016-2018 compliance years representing nearly 40 billion gallons of exempted gasoline and diesel volumes (farmdoc daily, September 19, 2019).
The retroactive manner in which the SREs were implemented under the first Trump Administration effectively reduced the conventional (ethanol) mandate. For example, the SREs awarded for 2017 reduced the conventional mandate from 15 billion gallons to 13.9 billion gallons (farmdoc daily, July 12, 2018). This was not only a large reduction in absolute terms, but, crucially, it resulted in the conventional mandate being set below the E10 blend wall. Additional SREs were awarded for the 2019 compliance year and expected SREs for the 2020 compliance year were part of the final EPA rulemaking for that year. However, a Tenth Circuit Court of Appeals decision in late January 2020 vacated most of the SREs granted in previous years and remanded the matter back to the EPA for further proceedings consistent with the opinion (farmdoc daily, March 12, 2020). While there has continued to be back and forth in the courts about SREs, the January 2020 decision marked the effective end of SREs having a major impact on the implementation of RFS mandates.
While there was never any doubt that SREs represented an indirect mechanism for reducing statutory and obligated RFS volumes, there was sharp disagreement about the impact of SREs on the physical demand for ethanol. On one side, obligated parties, mainly refiners, argued that physical ethanol demand was unaffected. On the other side, the corn ethanol industry argued there was substantial destruction of demand in the physical ethanol market due to SREs. A series of farmdoc daily articles (September 13, 2018; December 13, 2018; January 16, 2019: March 14, 2019) examined the impact of SREs in biofuel markets and found: i) little or no evidence of demand destruction for ethanol, and ii) substantial evidence of demand destruction for biomass-based diesel. However, these articles were published before January 2020, and therefore did not have complete data for the period when SREs potentially had the greatest market impact.
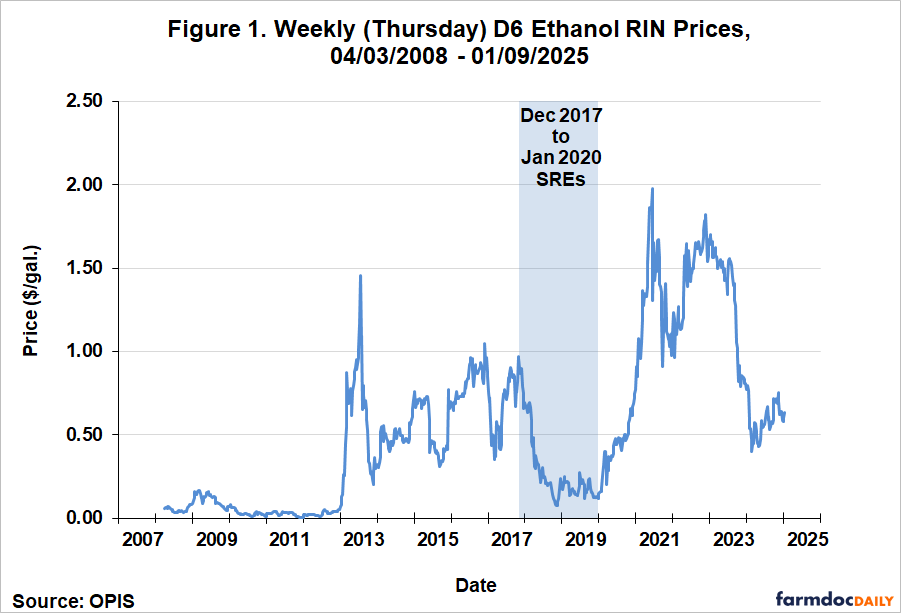
The first step of the analysis in the present article is to define the period of greatest SRE impact during the first Trump Administration. The argument made at the time by many in the corn ethanol industry was that SREs impacted ethanol demand indirectly through incentives provided by D6 ethanol RINs. (See the farmdoc daily article from May 24, 2023 for an overview of the RFS RIN compliance system.) Based on this logic, the relevant time window should start when SREs drove down D6 RIN prices sharply. Figure 1 presents weekly D6 ethanol RIN prices from April 3, 2008 through January 9, 2025. The figure shows that D6 prices peaked at just under $1.00 per gallon in late October 2017, and then started to plummet in December with the announcement of SREs. This suggests the impact of SREs on the physical demand for ethanol, if any, should have started around December 2017. This is the starting date we used in our previous analyses of the impact of SREs on biofuel demand (farmdoc daily, September 13, 2018; December 13, 2018; January 16, 2019;March 14, 2019). We can date the end of the SRE period to January 2020 based on the court case discussed above. D6 prices began to recover shortly after the court decision was announced and ultimately reached a high of nearly $2.00 per gallon in June 2021.
The next step of the analysis is to investigate the potential impact of SREs on physical ethanol consumption. We do not examine the level of ethanol consumption because it varies substantially over time due to seasonal factors as well as variation in aggregate income, interest rates, and other macroeconomic factors. Since gasoline consumption is driven by many of the same factors, we remove the effect of these factors by comparing the consumption of ethanol relative to the consumption of gasoline. By dividing ethanol consumption by gasoline consumption, we obtain the blend rate for ethanol, a measure of ethanol use that is independent of other of the factors that drive both ethanol and gasoline consumption. We employ the most inclusive measure of physical ethanol and gasoline consumption. Rather than being a direct survey estimate, ethanol consumption is implied based on the ethanol balance sheet as follows:
Domestic Use = Beginning Stocks + Production + Imports – Exports – Ending Stocks.
This measure of physical ethanol consumption should include all domestic sources (E10, E15, and E85) in the numerator of the blend rate. However, it also may be subject to measurement error since consumption is implied. In this sense, it is analogous to the computation of feed and residual use on a corn balance sheet. Finished motor gasoline consumption is implied in a similar manner. The data on ethanol and gasoline consumption are published by the EIA (Economic Information Agency) of the U.S. Department of Energy.
Figure 2 presents the monthly implied ethanol blend rate over January 2007 through November 2024. The blend rate was under five percent in 2007 and subsequently rose rapidly due to a boom in ethanol production. In 2010, the blend rate began to approach what is known as the E10 blend wall. Regulations in the U.S. historically limited the amount of ethanol in a gallon of gasoline to 10 percent by volume, and hence, the notion of a blend limit. The linear trend line fit to the data over 2011-2024 indicates that progress in breaching the blend wall due to the adoption of higher ethanol blends (E15 and E85) has been slow. For example, the average blend rate in 2011 was 9.6 percent and it only increased to 10.4 percent in 2023, an increase of 0.8 percentage points in 13 years.
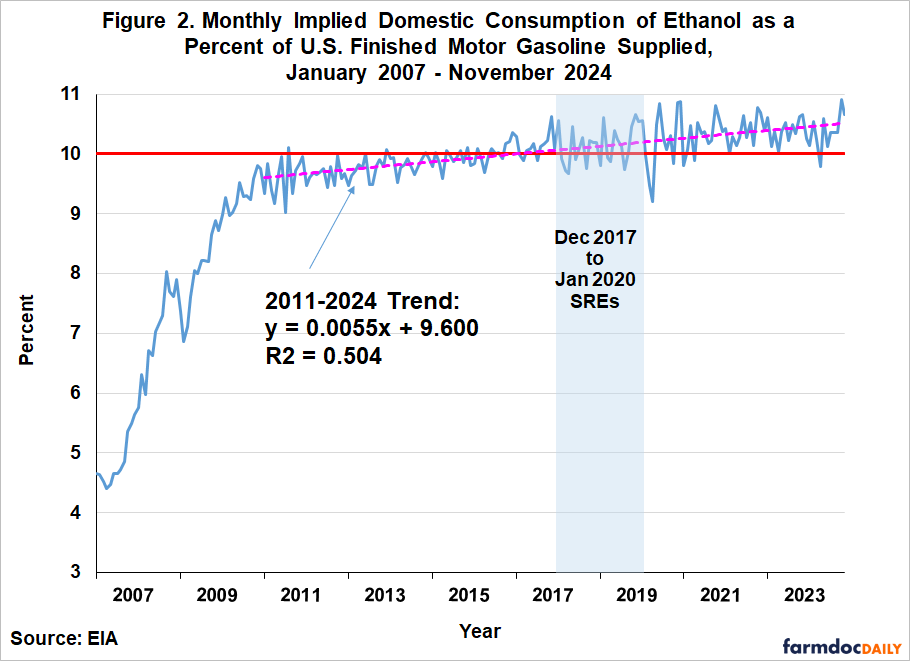
The key question we are interested in is whether the ethanol blend rate fell systematically during the period of heaviest SRE activity, indicated by the blue shading in the chart. Visually, it does not appear that the trend for the blend rate changed during the SRE period from December 2017 through January 2020. This was confirmed by formal statistical tests that allowed both the intercept and slope of the trend line to change during the SRE period. The estimated change coefficients were extremely small and statistically insignificant. Hence, this new analysis confirms our earlier finding that the impact of SREs on physical ethanol consumption was very small, if any. It is especially interesting to consider the stability of the trend in the ethanol blend rate before and after the SRE period. One can argue that the ethanol blend rate would have been even higher during the SRE period if not for the demand destruction caused by the SREs. However, if this were the case, we would expect faster growth in the blend rate after the SRE period ended. There is no evidence that this occurred. What we do observe is a small upward trend in the ethanol blend rate for nearly 14 years that has been remarkably steady in the face of large changes in policy, such as SREs, the COVID pandemic, and highly volatile energy prices.
Overall, the analysis provides no evidence that the physical consumption of ethanol was affected by SREs. The key question at this point is what this implies about the physical demand for ethanol, which is a function of both price and quantity (consumption). Fortunately, simple supply and demand logic allows us to reach a strong conclusion. If the supply curve for ethanol is fixed, then a decline in demand (downward shift) results in both price and quantity falling. Since we found that ethanol consumption (expressed in blend rate form) did not fall during the SRE period, assuming a fixed supply curve, this implies that ethanol demand did not change. It is theoretically possible to have a decline in demand and unchanging quantities. This requires the demand curve to shift downward and to the left at the same time the supply curve shifts downward and to the right. This seems an unlikely scenario during the period of the SREs between December 2017 and January 2020. The price of corn is the main shifter of the ethanol supply curve and low corn prices could have shifted the supply curve down and to the right as hypothesized. However, corn prices moved to lower price levels in 2014, several years before the SRE period began. A reasonable conclusion is that SREs did not cause a reduction in the physical demand for ethanol in E10 gasoline blends.
The conclusion that SREs did not destroy ethanol demand may seem counter-intuitive given the magnitude of the reduction of the conventional mandate due to the SREs and the precipitous drop in D6 RINs prices that resulted. As discussed in several previous farmdoc daily articles (January 30, 2015; February 3, 2016; February 17, 2016; March 15, 2017; April 4, 2019) the answer is that domestic ethanol generally is a price competitive component in the E10 gasoline blend for the U.S. The value of ethanol in E10 is primarily based on two components: i) an energy (MPG) penalty relative to petroleum gasoline because ethanol has a 2/3 of the energy content of petroleum gasoline; and ii) an octane premium based on the generally lower price of ethanol relative to petroleum sources of octane. Evidence on the octane value of ethanol is shown in Figure 3. The chart provides a comparison of the average price for aromatics (benzene, toluene, and xylene) and ethanol at the U.S. Gulf between January 5, 2007 and January 9, 2025. (The aromatic price is estimated after 2017 based on crude oil prices.) Aromatics represent one of the main petroleum competitors to ethanol as an octane enhancer in the E10 blend. Over this period, the price of aromatics averaged $1.16 more than the price of ethanol. In recent months, the gap has expanded to more than $1.50 per gallon. The evidence is clear that ethanol has been a price competitive source of octane in E10 gasoline blends.

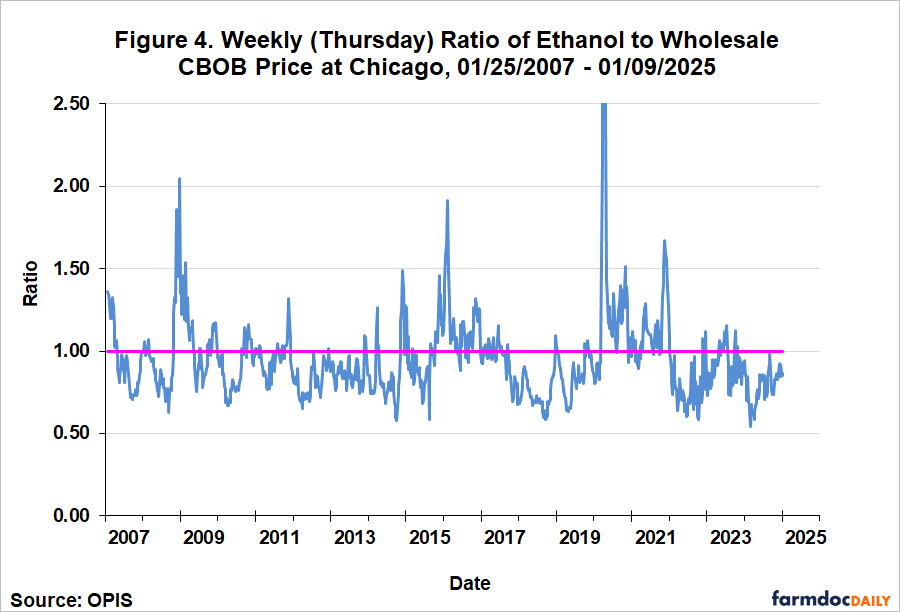
The price impact of adding ethanol to gasoline blends is approximately equal to the sum of the energy penalty and octane premium discussed above. Our previous research shows that the energy penalty and octane premium roughly offset one another (e.g., farmdoc daily, March 15, 2017), which implies that the breakeven price of ethanol in E10 is equal to the price of gasoline. Evidence in this regard is provided by Figure 4, which shows the ratio of weekly wholesale prices in Chicago for ethanol and CBOB gasoline over January 25, 2007 through January 9, 2025. Not surprisingly, the ratio is highly volatile over time, spending long periods above and below the benchmark of one. The sample average for the price ratio is 0.95, slightly below the benchmark of one but still quite close. If ethanol was only valued in the E10 market for its energy content, then this ratio would be around 0.67 since ethanol contains 2/3 of the energy per gallon as petroleum gasoline. That ethanol trades at an average ratio of 0.95 is strong evidence of the octane value of ethanol.
It is important to recognize that the impact of SREs on the demand for E15 and E85 may be different from E10. To begin, the energy penalty is larger for E15 and E85 simply because the ethanol content is higher than for E10. There is also considerable uncertainty whether the additional octane from ethanol in E15 and E85 provides extra value, and therefore, there is uncertainty how much this offsets the additional energy (MPG) penalty for higher ethanol blends. For this reason, it is conventional to assume that high D6 ethanol RIN prices are needed to incentivize drivers to purchase E15 and E85. Consequently, the demand for higher ethanol blends above the E10 blend wall depends on the level of D6 RIN prices (e.g., Lade, Pouliot, and Babcock, 2018). If SREs drove D6 RIN prices below the level necessary to incentivize E15 and E85 consumption, then demand for this segment of physical ethanol consumption would have been reduced by SREs. However, our previous analysis of E85 consumption (farmdoc daily, January 16, 2019) showed a consistent upward trend after December 2017, just the opposite of that predicted by the SRE-driven decline in D6 RIN prices. A possible explanation is that a USDA infrastructure program for blender pumps may have masked the negative incentive effect of lower RIN prices. Regardless, it is interesting to note the steady, albeit slow, rise in the ethanol blend rate above 10 percent in Figure 2. Given the enormous volatility in D6 ethanol prices shown in Figure 1, it suggests that growth in the demand for higher ethanol blends is mainly driven by factors other than the incentive provided by D6 RINs.
In sum, the evidence indicates that ethanol is a price competitive component in the E10 gasoline blend in the U.S. due to its octane value. This competitiveness means that the RFS conventional mandate up to the E10 blend wall is non-binding. Fundamentally, this is why SREs during the first Trump administration did not destroy domestic ethanol demand.
Implications
With the changeover of Administrations in Washington, D.C., there is uncertainty about how the U.S. Renewable Fuel Standard (RFS) mandates will be implemented going forward. One possibility is that the new Trump Administration will follow the playbook from the first Trump Administration and write down the conventional (ethanol) mandate to the level of the E10 blend wall. The chosen instrument for doing this in the first Trump administration was through small refinery exemptions (SREs). The previous episode with SREs provides a valuable test case regarding the potential for ethanol “demand destruction” if this policy is repeated in the new Trump Administration. We examined the aggregate blend rate for ethanol in the U.S. during the period of heaviest SRE activity—December 2017 through January 2020—and found no evidence that the blend rate fell systematically during this period. A reasonable conclusion is that SREs did not cause a reduction in the physical demand for ethanol in E10 gasoline blends. While there is a theoretical case to be made that the SREs reduced the physical demand for higher ethanol blends, such as E15 and E85, it is hard to find evidence for this in the data. The conclusion that SREs did not destroy ethanol demand may seem counter-intuitive, but there is a straightforward explanation. Ethanol is a price competitive component in the E10 gasoline blend in the U.S. due to its octane value. This competitiveness means that the RFS conventional mandate up to the E10 blend wall is non-binding, and fundamentally, this is why SREs during the first Trump administration did not destroy domestic ethanol demand. It is also why the corn ethanol industry has little to fear if the RFS conventional mandate is written down again in the second Trump Administration.
References
Coppess, J. and S. Irwin. "EPA and the Small Refinery Exemption Issue in the Renewable Fuel Standard Mandates." farmdoc daily (10):46, Department of Agricultural and Consumer Economics, University of Illinois at Urbana-Champaign, March 12, 2020.
Coppess, J. and S. Irwin. "EPA 2019 RFS Proposed Rulemaking: What You See Is Not What You Get." farmdoc daily (8):128, Department of Agricultural and Consumer Economics, University of Illinois at Urbana-Champaign, July 12, 2018.
Coppess, J. and S. Irwin. "Another Wrinkle in the RFS: The Small Refinery Exemption." farmdoc daily (7):224, Department of Agricultural and Consumer Economics, University of Illinois at Urbana-Champaign, December 6, 2017.
Federal Register. Vol. 85, no. 25. February 6, 2020. Rules and Regulations. https://www.govinfo.gov/content/pkg/FR-2020-02-06/pdf/2020-00431.pdf
Gerveni, M., T. Hubbs and S. Irwin. "Overview of the RIN Compliance System and Pricing of RINs for the U.S. Renewable Fuel Standard." farmdoc daily (13):95, Department of Agricultural and Consumer Economics, University of Illinois at Urbana-Champaign, May 24, 2023.
Gerveni, M., T. Hubbs and S. Irwin. "Overview of the U.S. Renewable Fuel Standard." farmdoc daily (13):90, Department of Agricultural and Consumer Economics, University of Illinois at Urbana-Champaign, May 17, 2023.
Gerveni, M. and S. Irwin. "Policy Priorities for Biomass-Based Diesel." farmdoc daily (15):17, Department of Agricultural and Consumer Economics, University of Illinois at Urbana-Champaign, January 29, 2025.
Irwin, S. "Clearing the Logjam on the RFS and SREs: A Simple Proposal." farmdoc daily (9):175, Department of Agricultural and Consumer Economics, University of Illinois at Urbana-Champaign, September 19, 2019.
Irwin, S. "Small Refinery Exemptions and Biomass-Based Diesel Demand Destruction." farmdoc daily (9):45, Department of Agricultural and Consumer Economics, University of Illinois at Urbana-Champaign, March 14, 2019.
Irwin, S. "Small Refinery Exemptions and E85 Demand Destruction." farmdoc daily (9):8, Department of Agricultural and Consumer Economics, University of Illinois at Urbana-Champaign, January 16, 2019.
Irwin, S. "More on Small Refinery Exemptions and Ethanol Demand Destruction." farmdoc daily (8):228, Department of Agricultural and Consumer Economics, University of Illinois at Urbana-Champaign, December 13, 2018.
Irwin, S. "Small Refinery Exemptions and Ethanol Demand Destruction." farmdoc daily (8):170, Department of Agricultural and Consumer Economics, University of Illinois at Urbana-Champaign, September 13, 2018.
Irwin, S. "Revisiting the Value of Ethanol in E10 Gasoline Blends." farmdoc daily (9):60, Department of Agricultural and Consumer Economics, University of Illinois at Urbana-Champaign, April 4, 2019.
Irwin, S. and D. Good. "On the Value of Ethanol in the Gasoline Blend." farmdoc daily (7):48, Department of Agricultural and Consumer Economics, University of Illinois at Urbana-Champaign, March 15, 2017.
Irwin, S., and D. Good. “More on the Competitive Position of Ethanol as an Octane Enhancer.” farmdoc daily (6):31, Department of Agricultural and Consumer Economics, University of Illinois at Urbana-Champaign, February 17, 2016.
Irwin, S. and D. Good. “The Competitive Position of Ethanol as an Octane Enhancer.” farmdoc daily (6):22, Department of Agricultural and Consumer Economics, University of Illinois at Urbana-Champaign, February 3, 2016.
Irwin, S., and D. Good. “Further Evidence on the Competitiveness of Ethanol in Gasoline Blends.” farmdoc daily (5):17, Department of Agricultural and Consumer Economics, University of Illinois at Urbana-Champaign, January 30, 2015.
Lade, G.E., S. Pouliot, and B.A. Babcock. “E15 and E85 Demand Under RIN Price Caps and an RVP Waiver.” CARD Policy Brief 18-PB-21, Iowa State University, March 2018. https://www.card.iastate.edu/products/publications/pdf/18pb21.pdf
Disclaimer: We request all readers, electronic media and others follow our citation guidelines when re-posting articles from farmdoc daily. Guidelines are available here. The farmdoc daily website falls under University of Illinois copyright and intellectual property rights. For a detailed statement, please see the University of Illinois Copyright Information and Policies here.