


Biomass-Based Diesel Demand Destruction 2.0?
A farmdoc daily article last week (February 5, 2025) examined the possible impact of reductions in the conventional mandate under the U.S. Renewable Fuel Standard (RFS) on the demand for ethanol in the physical market. A previous episode with small refinery exemptions (SREs) in the first Trump Administration provides an important test case. Specifically, the aggregate blend rate for ethanol in the U.S. during the period of heaviest SRE activity—December 2017 through January 2020—was examined and no evidence was found that the blend rate fell systematically during this period. A reasonable conclusion is that SREs did not cause a reduction in the physical demand for ethanol in E10 gasoline blends. This is not surprising because ethanol is a price competitive component in E10 gasoline blends due to its value as an octane enhancer. The situation is quite different for biomass-based diesel (BBD), because it is much more expensive than petroleum diesel, and therefore, the BBD mandate under the RFS is highly binding. Consequently, SREs are expected to reduce the physical demand for BBD (FAME biodiesel + renewable diesel). The purpose of this article is to investigate the magnitude of BBD demand destruction in the physical market due to SREs during the first Trump Administration to better understand potential impacts if the second Trump Administration follows suit.
Analysis
The RFS was created under the Energy Policy Act of 2005 and was later modified and expanded under The Energy Independence and Security Act of 2007 (farmdoc daily, May 17, 2023). The 2005 version of the program is known as “RFS1” and the 2007 version as “RFS2.” Since its inception, the program has been administered by the U.S. Environmental Protection Agency (EPA). RFS1 included a provision to exempt small refineries (fewer than 75,000 barrels of average aggregate daily crude oil throughput) from the specified biofuel mandates based upon a finding of a disproportionate economic hardship for the small refinery (or refiner), and this provision was not changed in RFS2. The implementation of small refinery exemptions (SREs) has changed substantially over time. Initially, RFS1 provided a statutory blanket exemption for all small refiners through 2010. In 2011, EPA temporarily extended the blanket exemption through 2012 in response to demands from Congress for a reassessment of the impacts on small refineries (farmdoc daily, December 6, 2017). From 2013 through 2016, the Obama Administration awarded only a few SREs. This policy was reversed in 2017 by the first Trump Administration, with the EPA granting a total of 85 SREs for the 2016-2018 compliance years representing nearly 40 billion gallons of exempted gasoline and diesel volumes (farmdoc daily, September 19, 2019).
The retroactive manner in which the SREs were implemented without reallocation under the first Trump Administration effectively reduced the size of all mandates, including the BBD mandate. For example, the SREs awarded for 2017 reduced the BBD mandate from 2.1 billion gallons to 1.92 billion gallons (farmdoc daily, July 12, 2018). Additional SREs were awarded for the 2019 compliance year and expected SREs for the 2020 compliance year were part of the final EPA rulemaking for that year. However, a Tenth Circuit Court of Appeals decision in late January 2020 vacated most of the SREs granted in previous years and remanded the matter back to the EPA for further proceedings consistent with the opinion (farmdoc daily, March 12, 2020). While there has continued to be back and forth in the courts about SREs, the January 2020 decision marked the effective end of SREs having a major impact on the implementation of RFS mandates.
A series of earlier farmdoc daily articles (September 13, 2018; December 13, 2018; January 16, 2019: March 14, 2019) examined the impact of SREs on biofuel markets and found: i) little or no evidence of demand destruction for ethanol, and ii) substantial evidence of demand destruction for biomass-based diesel. However, these articles were published before January 2020, and therefore did not have complete data for the period when SREs potentially had their greatest market impact.
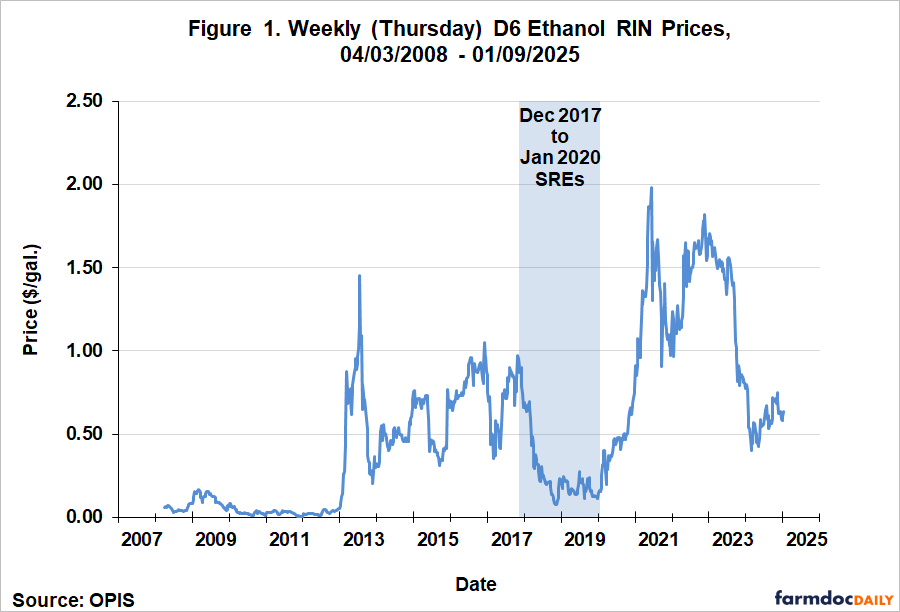
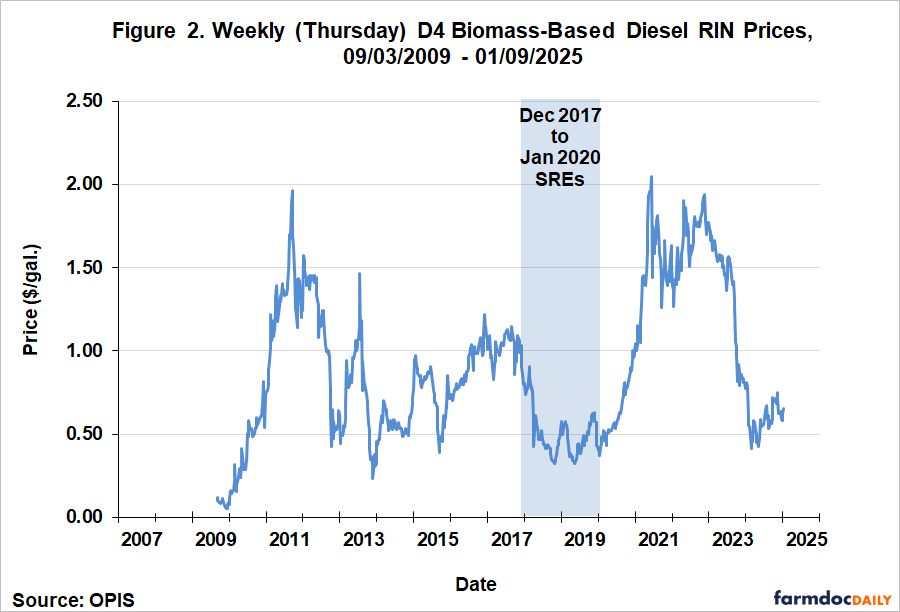
The first step of the present analysis is to define the period of greatest SRE impact during the first Trump Administration. The argument made at the time by many in the biofuel industry was that SREs impacted demand through incentives provided by RIN prices. (See the farmdoc daily article from May 24, 2023 for an overview of the RFS RIN compliance system.) Based on this logic, the relevant time window should start when SREs drove down RIN prices sharply. In our most recent article on ethanol demand destruction (farmdoc daily, February 5, 2025), D6 ethanol RIN prices were used to date the beginning of the SRE period. Figure 1 presents weekly D6 ethanol RIN prices from April 3, 2008 through January 9, 2025. The figure shows that D6 prices peaked at just under $1.00 per gallon in late October 2017, and then started to plummet in December with the announcement of SREs. This suggests the impact of SREs on the physical demand for ethanol, if any, should have started around December 2017. Figure 2 shows weekly D4 BBD RIN prices from September 3, 2009 through January 9, 2025, and they suggest that the impact of SREs on the physical demand for BBD should have started around the same time, December 2017. Note that this is the same starting date we used in our earlier analyses of the impact of SREs on biofuel demand (farmdoc daily, September 13, 2018; December 13, 2018; January 16, 2019: March 14, 2019). We can date the end of the most active SRE period to January 2020 based on the court case discussed above. Both D4 and D6 prices began to recover shortly after the court decision was announced and ultimately reached highs of nearly $2.00 per gallon in June 2021.
The next step of the analysis is to investigate the potential impact of SREs on physical BBD consumption. We do not examine the level of BBD consumption because it varies over time due to seasonal factors as well as variation in aggregate income, interest rates, and other macroeconomic factors. Since diesel consumption is driven by many of the same factors, we remove the effect of these factors by comparing the consumption of BBD relative to the consumption of diesel. By dividing BBD consumption by diesel consumption, we obtain the blend rate for BBD, a measure of BBD use that is independent of other of the factors that drive both BBD and diesel consumption. We employ the most inclusive measures of physical BBD and diesel consumption. Rather than being a direct survey estimate, BBD consumption is implied based on the FAME biodiesel and renewable diesel balance sheets as follows:
Domestic Use = Beginning Stocks + Production + Imports – Exports – Ending Stocks.
BBD domestic use is computed as the sum of the domestic use estimates for FAME biodiesel and renewable diesel. All data is published by the EIA (Economic Information Agency) of the U.S. Department of Energy except renewable diesel exports, which is estimated based on D4 RIN retirements (1.7 equivalent) reported by the EPA. Diesel consumption is implied in a similar manner by the EIA and reported as product supplied of distillate fuel oil.
Figure 3 presents the monthly implied BBD blend rate over January 2007 through November 2024. The blend rate was under one percent from 2007 through 2010 and subsequently rose rapidly, primarily due to a boom in FAME biodiesel production. The linear trend line fit to the pre-SRE period of January 2011 through November 2017 shows a sharp upward trend, with the BBD blend rate growing about half-a-percent per year. The downward shift in the trend with the start of the SRE period was swift, unmistakable, and statistically significant. The blue dashed line in the SRE period is a projection of the pre-SRE period trend and serves as an estimate of what the blend rate would have been without the SREs. On average, the difference between the blue dashed line and the red-dashed line during the SRE period is 1.3 percentage points. This is a large drop in economic terms given that the blend rate just before the SRE period began was about four percent. The blending rate declines can be easily converted into physical gallons by multiplying the decline in blending rates for a month by total diesel consumption for that month. Doing this for each month and summing across December 2017 through January 2020 results in a total estimated BBD demand decline of 1.73 billion gallons due to the SREs.
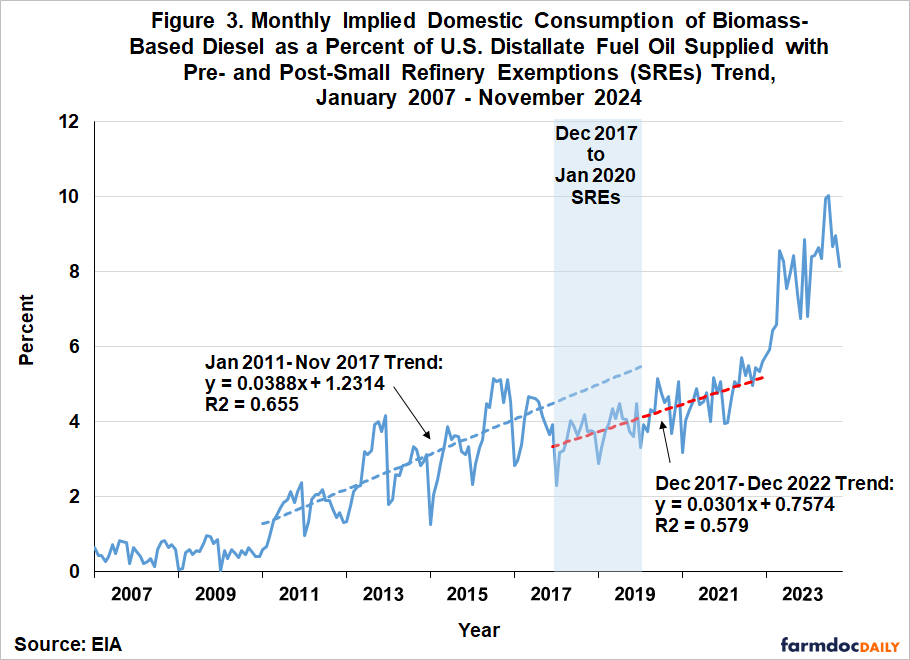
It is interesting to note in Figure 2 that the lower trend for the BBD blend rate established during the SRE period continued until the end of 2022. There is no statistical difference between the trend in the SRE period of December 2017 through January 2020 and the post-SRE period of February 2020 through December 2022. One might have expected the BBD blend rate in the post-SRE period to resume the trend established in the pre-SRE period. There is a logical explanation why this did not happen. The COVID pandemic began in March 2020, shortly after the SRE period ended in January 2020. During the pandemic, obligated parties under the RFS were given broad leeway by the EPA for compliance and the mandates for 2020 and 2021 were eventually written down to reflect the large drops in gasoline and diesel consumption that occurred during the pandemic years. The write downs of the mandates for 2020 and 2021 ending up having a similar impact on the trend for the BBD blend rate as the earlier SREs. About the same time that the pandemic was winding down in 2021-22, the renewable diesel boom began. This lifted the BBD blend rate to a level that actually exceeded the pre-SRE trend. In June 2024, the BBD blend rate touched 10 percent, a level usually associated with ethanol.
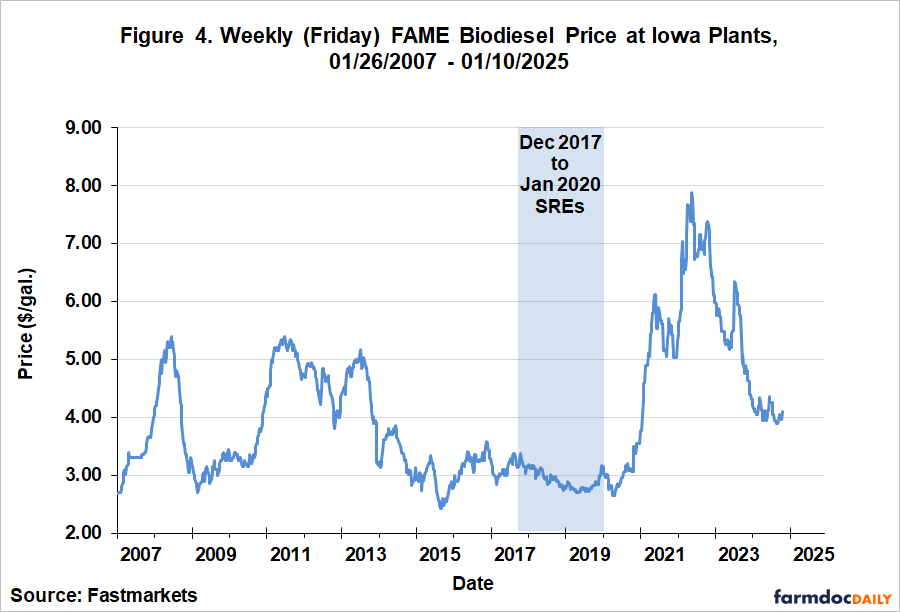
Consistent with our previous analysis (farmdoc daily, March 14, 2019), the results indicate that SREs wreaked considerable demand destruction on BBD. Of course, quantity (blending rate in this case) is only half of the story when demand declines. Given a fixed supply curve, both quantity and price should decline when a demand curve shifts downward. Since BBD primarily consisted of FAME biodiesel during the SRE period, Figure 4 shows the weekly price of biodiesel at Iowa plants from January 26, 2007 through January 10, 2025. As before, the SRE period is indicated by the blue shaded region. Biodiesel prices declined exactly as one would expect based on a downward shift in the BBD demand curve. The average price of biodiesel from January 2016 through November 2017 was $3.16 per gallon. The average price during the following SRE period was $2.92 per gallon, a drop of $0.24. The bottom of prices during the SRE period was $2.72, among the lowest prices observed over this 18-year period. Some may be surprised that the magnitude of the average price decline during the SRE period was not even larger given the size of the reductions in BBD use. This actually makes sense given what we know about the elasticity of supply for BBD. Our previous work (e.g., farmdoc daily, July 26, 2017) indicates that BBD supply is extremely elastic; in other words, the BBD supply curve is very flat. Consequently, large downward shifts in the BBD demand curve cause large declines in use but much smaller declines in price.
We now have sufficient data to make a rough estimate of the economic damage of SREs to the BBD industry. We do this by estimating the revenue of BBD producers assuming that SREs were not awarded, and then compare this to the actual revenue of producers during the SRE period. Computation of the “but for” revenue during the SRE period is based on the blue-dashed line in Figure 3, which is the projection of the pre-SRE trend in the BBD blend rate for the SRE period. The projected blend rate for each month is multiplied by actual diesel use to estimate BBD use in gallons assuming the absence of SREs. Next, the projected use in each month is multiplied by the average biodiesel price for January 2016 through November 2017 to obtain the “but for” estimate of revenue. This pre-SRE period is assumed to provide a reasonable estimate of the price of FAME biodiesel that would have occurred in the absence of SREs. Computation of the actual revenue of BBD producers during the SRE period follows a similar procedure. The observed blend rate for each month during the SRE period is first converted to gallons of BBD, and then use in gallons is multiplied by the average biodiesel price for the month (Figure 4) to obtain observed revenue for the month. Summing across the difference in the two sets of revenue estimates results in $6.7 billion dollars of lost revenue to BBD producers as a result of the SREs. The economic cost of the SREs to the BBD industry was large by any standard.
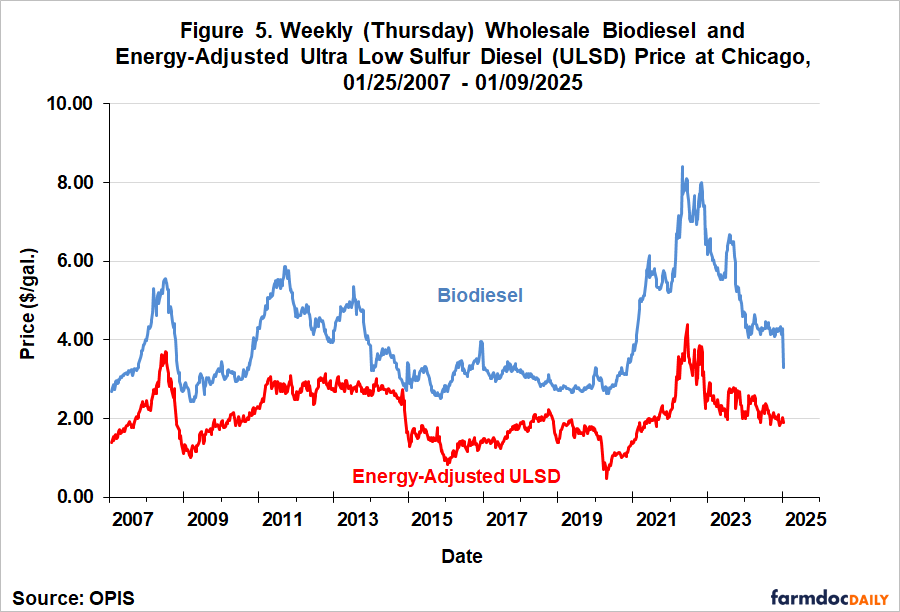
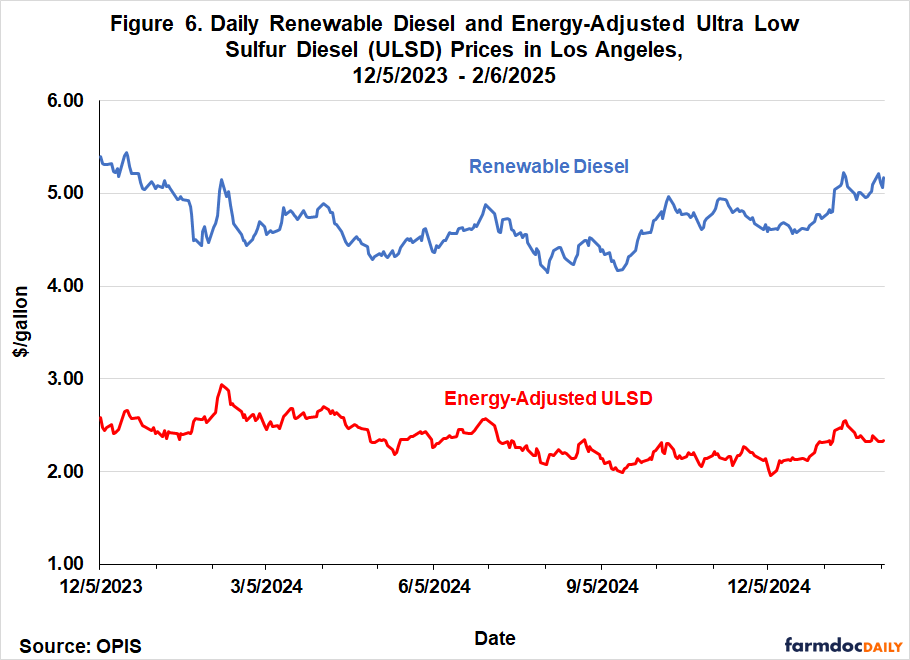
An important remaining question is why the damage from SREs was so severe for BBD, but, as noted in the introduction, not for ethanol. The answer is twofold. First, BBD plays an oversized role in the RFS because it fills three different “buckets” in terms of compliance (e.g., farmdoc daily, January 15, 2025; January 29, 2025). More specifically, BBD is the marginal gallon for filling the BBD, undifferentiated advanced, and conventional mandates. Since SREs without reallocation reduce the size of each of these mandates, the cumulative impact on BBD demand is large. Second, BBD prices are substantially higher than petroleum diesel, which means that BBD is not price competitive with petroleum diesel. Evidence in this regard is shown in Figures 5 and 6 for FAME biodiesel and renewable diesel, respectively. FAME biodiesel prices in Chicago over January 25, 2007 through January 9, 2025 averaged $1.91 per gallon more than energy-adjusted ultra low sulfur diesel (ULSD) prices, or 91 percent higher. Renewable diesel prices in Los Angeles for the shorter sample period of December 5, 2023 through February 6, 2025 averaged $2.25 per gallon more than ULSD prices, or almost exactly 100 percent higher. The bottom-line is that BBD prices tend to be about twice as high as ULSD prices. The relatively high prices for BBD imply that there is no safety-net below the mandated level of demand, and therefore, the full brunt of reductions in the mandates is borne by BBD. In contrast, ethanol is a price competitive blend component in E10, which limits any damage from SREs to the demand for higher ethanol blends such as E15 and E85. And the evidence is that the damage from SREs for even these higher ethanol blends was limited (farmdoc daily, February 5, 2025).
Implications
There is considerable uncertainty about how the U.S. Renewable Fuel Standard (RFS) mandates will be implemented under the new Trump Administration. One possibility is that the new Administration will follow the playbook from first Trump Administration and write down the mandates through the retroactive awarding of large numbers of small refinery exemptions (SREs). The previous episode with SREs provides a valuable test case regarding the potential for biomass-based diesel (BBD) “demand destruction” if this policy is repeated in the new Trump Administration. We examined the aggregate blend rate for BBD in the U.S. during the period of heaviest SRE activity—December 2017 through January 2020—and found strong evidence that the blend rate fell swiftly and systematically during this period. On average, the BBD blend rate during the SRE period fell by 1.3 percentage points, which is quite large given that the blend rate just before the SRE period began was about four percent. In gallon terms, total BBD demand declined 1.73 billion gallons due to the SREs. It is reasonable to conclude that SREs wreaked considerable demand destruction on BBD. The economic value of the demand destruction is estimated to be a loss of $6.7 billion. The BBD industry has much to fear if an SRE episode is repeated in the second Trump Administration.
References
Coppess, J. and S. Irwin. "EPA and the Small Refinery Exemption Issue in the Renewable Fuel Standard Mandates." farmdoc daily (10):46, Department of Agricultural and Consumer Economics, University of Illinois at Urbana-Champaign, March 12, 2020.
Coppess, J. and S. Irwin. "EPA 2019 RFS Proposed Rulemaking: What You See Is Not What You Get." farmdoc daily (8):128, Department of Agricultural and Consumer Economics, University of Illinois at Urbana-Champaign, July 12, 2018.
Coppess, J. and S. Irwin. "Another Wrinkle in the RFS: The Small Refinery Exemption." farmdoc daily (7):224, Department of Agricultural and Consumer Economics, University of Illinois at Urbana-Champaign, December 6, 2017.
Gerveni, M., T. Hubbs and S. Irwin. "Overview of the RIN Compliance System and Pricing of RINs for the U.S. Renewable Fuel Standard." farmdoc daily (13):95, Department of Agricultural and Consumer Economics, University of Illinois at Urbana-Champaign, May 24, 2023.
Gerveni, M., T. Hubbs and S. Irwin. "Overview of the U.S. Renewable Fuel Standard." farmdoc daily (13):90, Department of Agricultural and Consumer Economics, University of Illinois at Urbana-Champaign, May 17, 2023.
Gerveni, M., T. Hubbs, S. Irwin and S. Ramsey. "Revisiting the RIN Cliff." farmdoc daily (15):10, Department of Agricultural and Consumer Economics, University of Illinois at Urbana-Champaign, January 15, 2025.
Gerveni, M. and S. Irwin. "Policy Priorities for Biomass-Based Diesel." farmdoc daily (15):17, Department of Agricultural and Consumer Economics, University of Illinois at Urbana-Champaign, January 29, 2025.
Gerveni, M. and S. Irwin. "Policy Priorities for Biomass-Based Diesel." farmdoc daily (15):17, Department of Agricultural and Consumer Economics, University of Illinois at Urbana-Champaign, January 29, 2025.
Irwin, S. "Ethanol Demand Destruction 2.0?" farmdoc daily (15):22, Department of Agricultural and Consumer Economics, University of Illinois at Urbana-Champaign, February 5, 2025.
Irwin, S. "Clearing the Logjam on the RFS and SREs: A Simple Proposal." farmdoc daily (9):175, Department of Agricultural and Consumer Economics, University of Illinois at Urbana-Champaign, September 19, 2019.
Irwin, S. "Small Refinery Exemptions and Biomass-Based Diesel Demand Destruction." farmdoc daily (9):45, Department of Agricultural and Consumer Economics, University of Illinois at Urbana-Champaign, March 14, 2019.
Irwin, S. "Small Refinery Exemptions and E85 Demand Destruction." farmdoc daily (9):8, Department of Agricultural and Consumer Economics, University of Illinois at Urbana-Champaign, January 16, 2019.
Irwin, S. "More on Small Refinery Exemptions and Ethanol Demand Destruction." farmdoc daily (8):228, Department of Agricultural and Consumer Economics, University of Illinois at Urbana-Champaign, December 13, 2018.
Irwin, S. "Small Refinery Exemptions and Ethanol Demand Destruction." farmdoc daily (8):170, Department of Agricultural and Consumer Economics, University of Illinois at Urbana-Champaign, September 13, 2018.
Irwin, S. and D. Good. "Revisiting the Estimation of Biomass-Based Diesel Supply Curves." farmdoc daily (7):135, Department of Agricultural and Consumer Economics, University of Illinois at Urbana-Champaign, July 26, 2017.
Disclaimer: We request all readers, electronic media and others follow our citation guidelines when re-posting articles from farmdoc daily. Guidelines are available here. The farmdoc daily website falls under University of Illinois copyright and intellectual property rights. For a detailed statement, please see the University of Illinois Copyright Information and Policies here.