








2025 Final ARC/PLC Payments
Final marketing year average (MYA) prices were recently released by the USDA for nearly all eligible commodities, and the Farm Service Agency (FSA) has finalized the payments for most commodities from the Agricultural Risk Coverage (ARC) and Price Loss (PLC) programs for the 2025 crop year. This article summarizes the actual 2025 payments, which producers should receive by the end of October. Overall, payment rates were substantial and widespread across most of the US for corn, soybeans and wheat, averaging $62, $29 and $47 per base acre, respectively.
Estimated 2025 Total ARC and PLC Payments
Changes to commodity title programs were enacted through the One Big Beautiful Bill Act (OBBBA). Over time, these changes will result in higher ARC/PLC payment rates compared to the previous Farm Bill. Price and yield conditions in 2025 were expected to result in substantial payments in particular. More detailed discussion on the changes in OBBBA were provided in articles from July 2025 (see farmdoc daily articles from July 3 and July 15, 2025). Importantly, given that OBBBA was signed after the ARC/PLC enrollment period for 2025, a special rule was applied in which farmers would get the maximum payment from ARC-CO or PLC if they enrolled in either of these programs. Payment estimates were also discussed at various points in the 2025 marketing year in previous articles (see farmdoc daily articles from November 18, 2025 and May 14, 2026).
Final 2025 marketing year average (MYA) prices ($/bushel) for the major crops in the Midwest are as follows: $4.16 (corn), $10.50 (soybeans) and $5.06 (wheat). With the final prices, FSA released final ARC-CO payment rates and PLC payment rates (see the FSA website for more details). The final MYA prices for corn, soybeans, and wheat were all below their effective reference prices for 2025. The PLC payment rate ($ per bushel) is $0.26 for corn, $0.21 for soybeans, and $1.29 for wheat. The MYA prices for most crops were below their effective reference prices. Exceptions include barley, oats, sunflower seed, mustard seed, rapeseed, sesame seed, and crambe.
To estimate actual $ per base acre payment rates at the county level for each commodity, we compare ARC and PLC payment rates and calculate their maximum. For PLC, we use the average PLC payment yield for each county multiplied by each commodity’s $ per bushel PLC payment rate. Thus, individual farm’s final payment rates may vary from estimates presented here for situations where PLC provided the largest payment. Estimated payment rates are then multiplied by the 85% payment factor.
Total estimated 2025 ARC/PLC payments for all eligible commodities are shown in Table 1. For total payment estimates by crop, we multiply payment rates (excluding irrigated practice) per base acre by 2025 enrolled base acres from FSA. Total payment estimates are not adjusted for the 5.7% sequestration factor that will be applied to payments issued to producers.
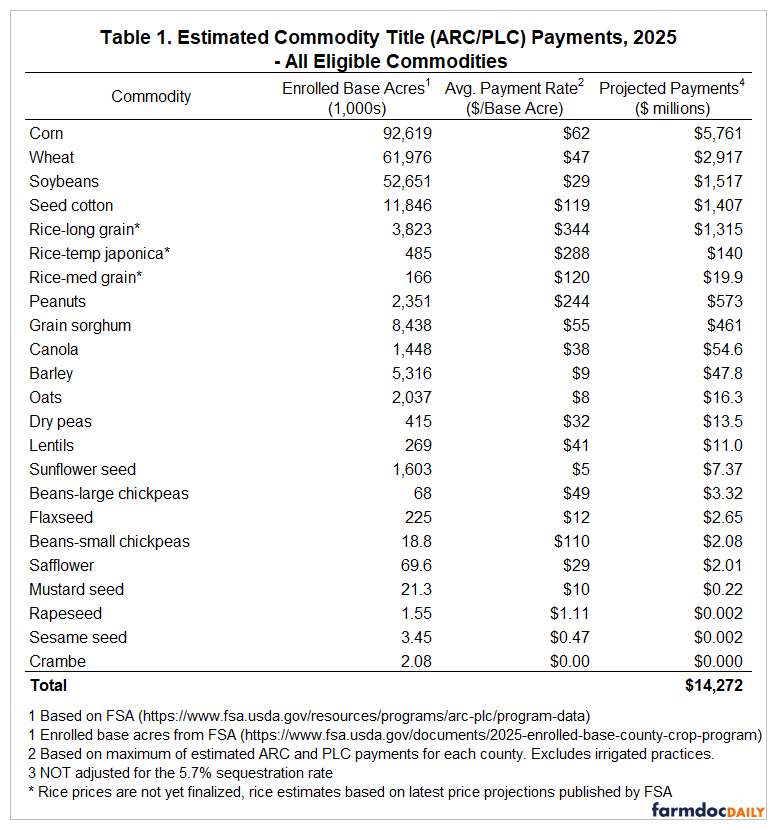
The estimates in Table 1 are very much in line with previous estimates made for corn, wheat, and soybeans in May 2026 (see farmdoc daily May 14, 2026). As the crops with the largest amounts of base acres, payments on corn, soybean, and wheat base acres are the largest in terms of total payments at just over $10 billion. Support levels on a $ per base acre basis are largest for rice ($120 per base acre for medium-grain, $288 for temperate japonica, and $344 for long-grain), peanuts ($244 per base acre), and seed cotton ($119 per base acre). These per base acre support levels are substantially higher than for the other eligible commodities.
Total support across all eligible commodities is estimated at just over $14 billion. This exceeds the estimate of $13.8 billion publicized by the USDA. Differences could be due to variations in farm-level PLC payment yields that we are unable to capture using county averages, payments on irrigated practice acres (our estimates use payment rates for ‘all’ and ‘non-irrigated’ practices only), differences in estimates for payments on rice base acres as the MYA prices for the three types of rice have yet to be finalized, and individual payment limits that we are unable to account for in our estimates.
County Level Payment Rates for Corn, Soybeans, and Wheat
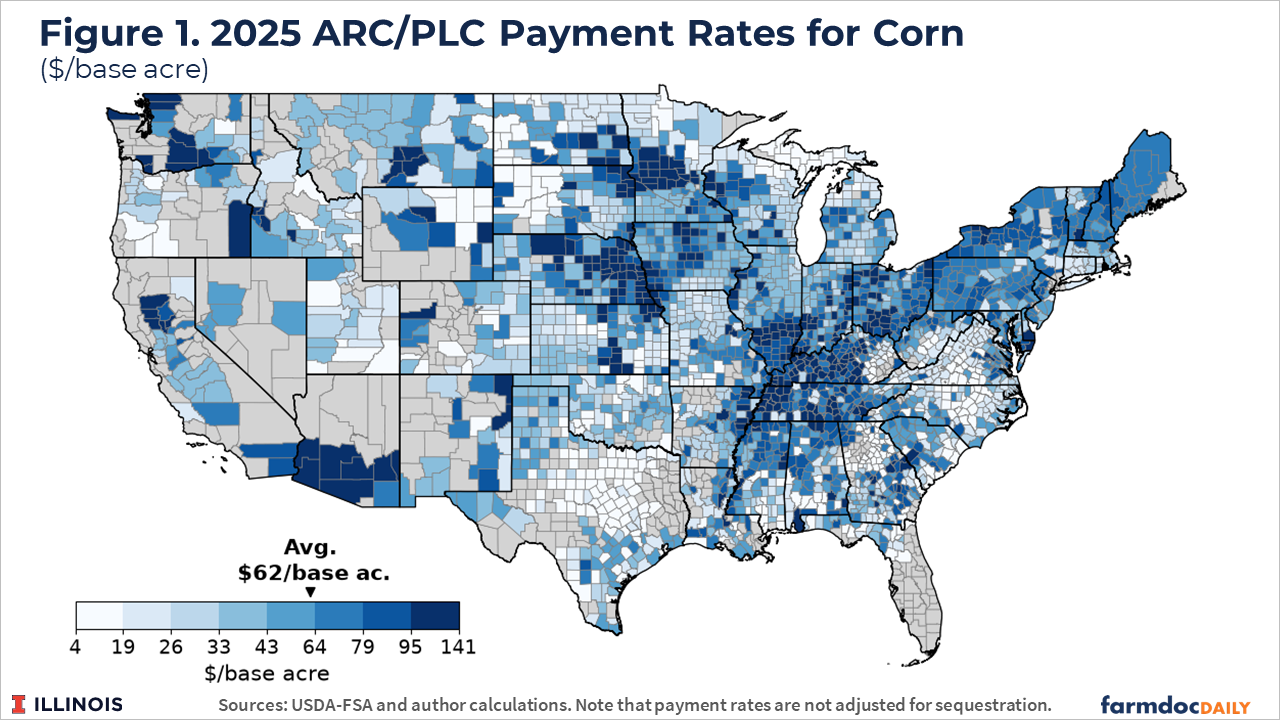
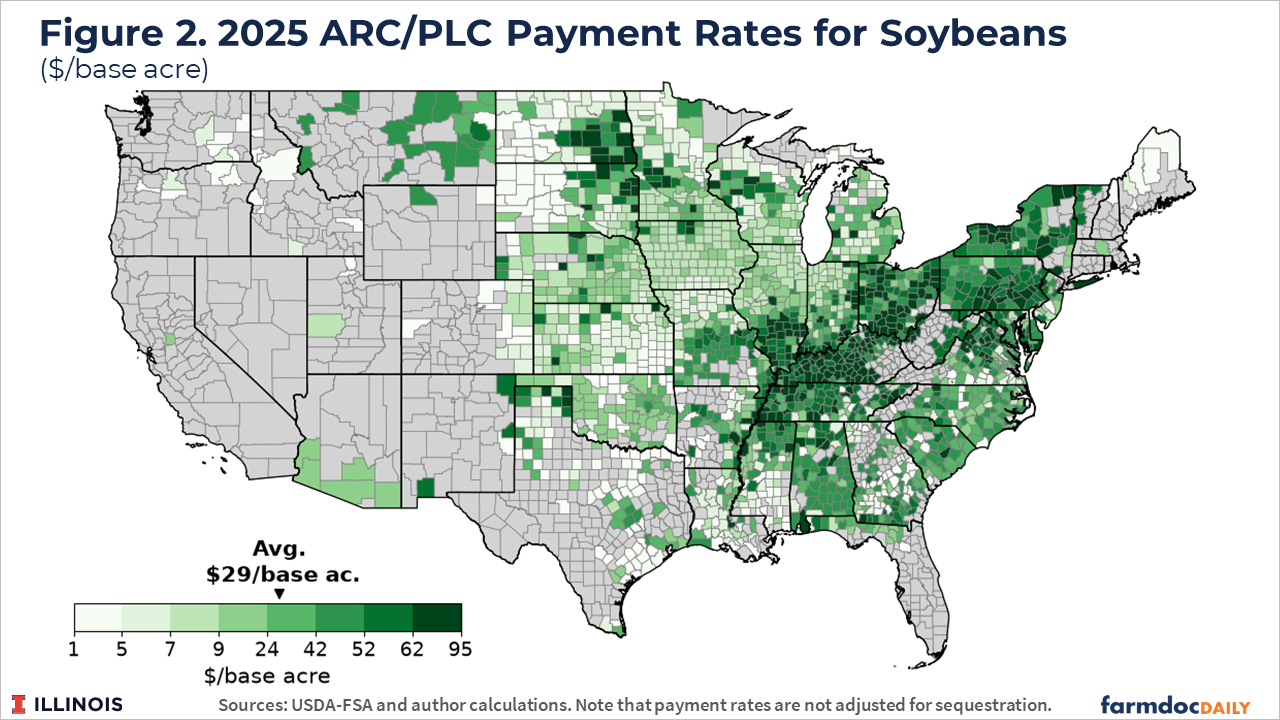
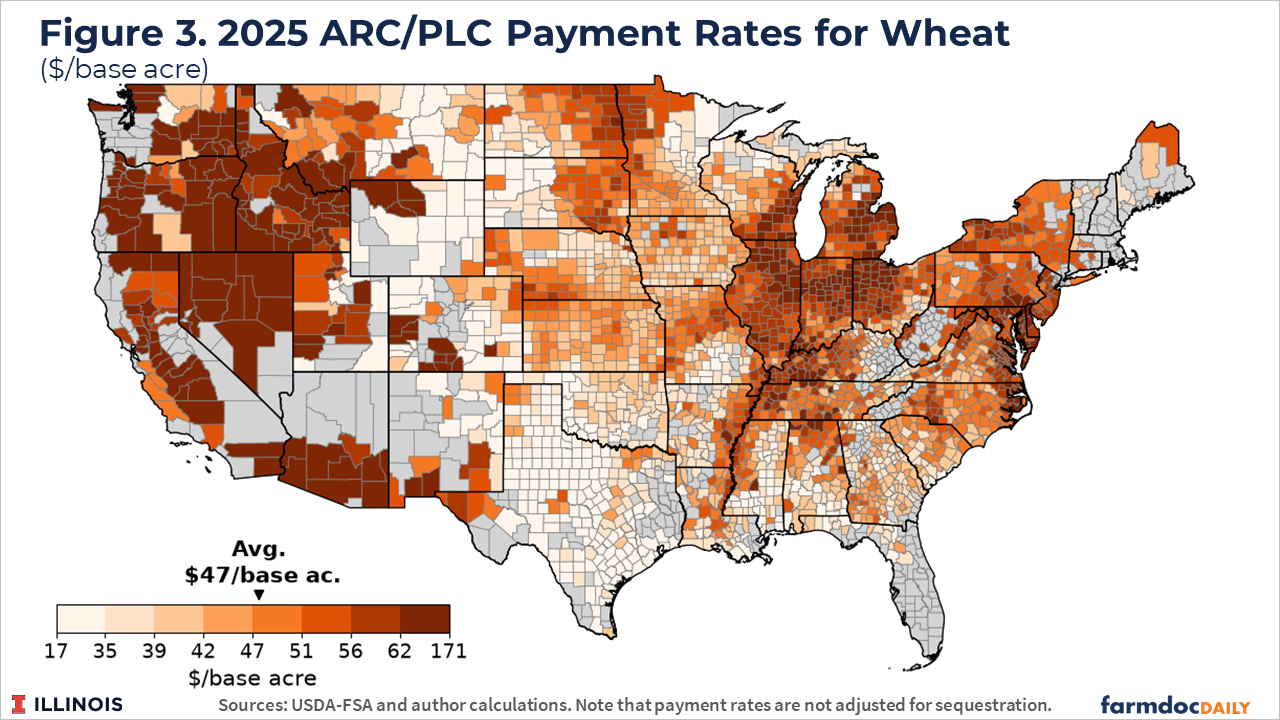
Figures 1 through 3 show ARC/PLC payment rates by county for corn, soybeans, and wheat, respectively. Again, the per base acre payment rates include the 85% payment factor but do not account for sequestration.
Payment rates for corn (figure 1) tended to be highest in areas where ARC-CO payment rates were larger than for PLC, which in turn was often where yield performance at the county level was poor relative to the benchmark (see farmdoc daily article from July 14, 2026 for a more detailed discussion of 2025 FSA county yields relative to ARC-CO benchmarks). These areas include central and eastern Nebraska, west central and southern Minnesota, northeastern South Dakota, central and northern Iowa, southern and east central Illinois, southwestern Indiana, central and southern Kentucky, western and central Tennessee, northern Mississippi, southern and northwestern Ohio, and western New York.
County-level payment rates for soybean base acres are provided in Figure 2. Similar to corn, payment rates on soybean base acres were largest in areas with relatively poor yields where ARC-CO ended up triggering the larger payment. These areas include central, southern and western Kentucky, southern and east central Illinois, western and central Tennessee, southern and western Ohio, southeastern North Dakota, central Pennsylvania, western New York, northern Virginia, and northern Mississippi.
County-level payment rates for wheat base acres are provided in Figure 3. While ARC-CO made higher payments for 61% of counties for corn and soybeans, PLC made higher payments for 79% of counties for wheat. The largest payment rates for wheat occur in the US West and Rocky Mountain regions. Payment rates were also high in many other areas, including Illinois, Indiana, Ohio, Michigan, southeastern Wisconsin, western Kentucky, northeastern North Dakota, northwestern MN, and areas along the eastern seaboard and Mississippi River.
Discussion
The ARC/PLC programs will provide significant payments to farmers over the next few weeks. Our estimates are at just over $14 billion in payments across all eligible commodities, while USDA estimates have been publicized at $13.8 billion. Either figure would represent a record for ARC/PLC payments. Total estimated payments on corn ($5.8 billion), soybeans ($1.5 billion), and wheat ($2.9 billion) base acres are the largest across the eligible commodities at just over $10 billion. The highest payment rates on a $ per base acre basis are estimated to go to rice ($120 to $344 per base acre), peanuts ($244 per base acre) and seed cotton ($119 per base acre).
The increase in support reflects changes to commodity programs from the OBBBA in July 2025. These included increases in the reference prices used for the PLC program and a changes to the coverage level (increased from 86% to 90%) and per acre payment cap (increased from 10% to 12% of benchmark revenue) for ARC-CO. Payments for 2025 are also larger because farmers will receive the higher of the payments from the ARC and PLC programs regardless of their enrollment choice made in March of 2025 prior to passage of the OBBBA.
USDA also recently announced that enrollment is now open for the 2026 ARC and PLC programs, with a decision deadline of December 11, 2026. Producers should keep in mind that for 2026 they will return to making a decision for which program to enroll their base acres – the maximum payment from the programs was a one-time allowance for 2025 only. The OBBBA changes to the program payment parameters will remain in place for the 2026 through 2031 marketing years.
Over the coming weeks we will provide resources to help producers make more informed election and enrollment decisions based on the information available ahead of the December deadline. We encourage readers to consider joining us for a farmdoc webinar on the First Look at the ARC/PLC decision for 2026 next Thursday October 22nd at 11:00 am central time (direct link to webinar registration).
Additional Information and Resources
- Payments rates for all US counties and crops (‘all’ and ‘non-irrigated’ practices only) are available in Excel table format here: US County Payment Table
- Illinois county payment rates for corn, soybeans, and wheat are available in Excel table format here: Illinois County Payment Table
- County-level maps for corn, soybean and wheat payments rates in Illinois are available here: IL County Payment Maps
- Minnesota county payment rates and maps for corn, soybeans, and wheat are available here: Minnesota County Payment Information
References
Monaco, H., J. Coppess, N. Paulson and G. Schnitkey. "Farm Bill in Reconciliation: ARC/PLC Payment Projections; Policy Design Lab Update." farmdoc daily (15):122, Department of Agricultural and Consumer Economics, University of Illinois at Urbana-Champaign, July 3, 2025.
Monaco, H., G. Schnitkey, N. Paulson, J. Coppess and C. Zulauf. "2025 ARC/PLC Final Estimates." farmdoc daily (16):85, Department of Agricultural and Consumer Economics, University of Illinois at Urbana-Champaign, May 14, 2026.
Paulson, N., C. Zulauf, H. Monaco and G. Schnitkey. "Initial 2025 FSA Yields and ARC-CO for Corn, Soybeans, and Wheat." farmdoc daily (26):123, Department of Agricultural and Consumer Economics, University of Illinois at Urbana-Champaign, July 14, 2026.
Paulson, N., H. Monaco, G. Schnitkey, J. Coppess and C. Zulauf. "Projected ARC and PLC Payments for 2025." farmdoc daily (15):213, Department of Agricultural and Consumer Economics, University of Illinois at Urbana-Champaign, November 18, 2025.
Schnitkey, G., N. Paulson, C. Zulauf and J. Coppess. "Impacts of the Commodity Title Changes Under the One Big Beautiful Bill Act (OBBBA) for Midwestern Farms in 2025." farmdoc daily (15):128, Department of Agricultural and Consumer Economics, University of Illinois at Urbana-Champaign, July 15, 2025.
Disclaimer: We request all readers, electronic media and others follow our citation guidelines when re-posting articles from farmdoc daily. Guidelines are available here. The farmdoc daily website falls under University of Illinois copyright and intellectual property rights. For a detailed statement, please see the University of Illinois Copyright Information and Policies here.