


The Profitability of Biodiesel Production in 2016
The U.S. biodiesel production industry has a distinct “feast or famine” pattern in terms of profitability. The industry made very large profits in 2011 and 2013, but losses in most years previous to 2011 and losses again in 2014 and 2015 (e.g., farmdoc daily, January 28, 2015; February 11, 2016). The feast or famine pattern is closely tied to expiration of the $1 per gallon biodiesel tax credit in the face of binding RFS biodiesel mandates. The biodiesel tax credit expired at the end of 2016, which should have led to another major boom in profits. However, a mid-year analysis of 2016 biodiesel production profitability (farmdoc daily, July 27, 2016) suggested that the boom might not last as long or peak as high as in previous years. The purpose of this article is to provide a full-year review of biodiesel production profitability in 2016 and assess whether the profitability boom was indeed smaller than in previous years when the biodiesel tax credit expired.
Analysis
As in earlier farmdoc daily articles (e.g., March 19, 2014; October 30, 2014; January 28, 2015; February 11, 2016; July 27, 2016) a model of a representative Iowa plant is used to assess biodiesel production profitability. The model incorporates several key assumptions:
- 30 million gallon annual biodiesel production capacity
- Plant construction cost of $1.57 per gallon of nameplate capacity
- 50 percent debt and 50 percent equity financing
- 8.25 percent interest on 10-year loan for debt financing
- Plant operates at 100 percent of nameplate capacity
- Plant only processes soybean oil into biodiesel
- Conversion factor of 7.55 pounds of soybean oil per gallon of biodiesel
- 0.9 pounds of glycerin co-product per gallon of biodiesel
- 7 cubic feet of natural gas per gallon of biodiesel
- 0.71 pounds of methanol per gallon of biodiesel
- Other variable input costs of 25 cents per gallon of biodiesel
- Total fixed costs of 26 cents per gallon of biodiesel
This model is meant to be representative of an “average” plant constructed since 2006 to process soybean oil into biodiesel. There is certainly substantial variation in capacity, production efficiency, and feedstock across the industry and this should be kept in mind when viewing profit estimates from the model. However, limiting the feedstock to soybean oil is reasonable since it represents about half of the feedstock used to produce biodiesel in the U.S. and feedstock prices tend to be highly correlated.
To track plant profitability over time, weekly biodiesel and soybean oil prices at Iowa plants from the Agricultural Marketing Service (AMS) were collected starting in 2007. Natural gas costs through 2013 are estimated based on monthly data from the Energy Information Agency (EIA). Due to a change in the EIA price series, natural gas costs are estimated as one percent of the nearby NYMEX natural gas futures price starting in January 2014. Glycerin and methanol prices were obtained from OPIS. Figure 1 presents the weekly (pre-tax) estimates of biodiesel profits over January 26, 2007 through February 24, 2016 based on the prices and model assumptions. Two enormous spikes in 2011 and 2013 dominate the weekly profitability estimates, when profits exceeded $1 per gallon. There was clearly a spike in profitability in 2016 as well, but the peak was only about $0.50 per gallon and it occurred much earlier in the calendar year (May). The average level of profits in 2011, 2013, and 2016 was $0.43, $0.50, and $0.19 per gallon, respectively. Outside of these three years, the average level of profits was -$0.04 per gallon.

The spike in profitability during 2011, 2013, and 2016 can be directly traced to the race by diesel blenders to take advantage of the blender tax credit set to expire at the end of these calendar years (e.g., farmdoc daily March 19, 2014; July 27, 2016). The key is that blenders face a binding RFS biodiesel mandate, and it is rational to effectively purchase biodiesel at a discount in the current year, due to the tax credit, in order to meet mandates in later years. Once the tax credit expires, the incentive to push up prices, profits, and production disappears and the biodiesel industry returns to a norm of losses. This cycle, of course, depends on blenders perceiving there is substantial uncertainty whether the tax credit will be reinstated or not for the following year.
Additional insight about the feast and famine cycle of biodiesel profits is provided in Figure 2. Here, the biodiesel price at Iowa plants is plotted versus a simplified breakeven profit relationship between soybean oil and biodiesel prices. Since soybean oil represents over 80 percent of the variable operating costs of the representative plant, all other costs are lumped into the constant term of 0.60, or 60 cents per gallon of biodiesel produced. The 7.55 slope is just the number of pounds of soybean oil assumed to produce a gallon of biodiesel. The breakeven relationship tracks the biodiesel price very closely outside of the spikes in 2011, 2013 and 2016. In other words, outside of these periods, the market has generally priced biodiesel based on the cost of soybean oil, a partial markup for other variable and fixed costs, and zero profits. Implicit in this formulation is the idea that soybean oil prices lead (or cause) biodiesel prices at the weekly time horizon (farmdoc daily, September 10, 2015). The norm of losses outside of the spike periods can be traced to over-capacity in the U.S. biodiesel industry (farmdoc daily, February 11, 2016), as capacity utilization rates have rarely exceeded 75 percent and have been closer to 60 percent much of the time.

An obvious question at this point is why the expiration of the biodiesel tax credit in 2016 did not cause as large of a spike in profitability as in 2011 and 2013. It was not a coincidence that the biodiesel price in 2011 and 2013 was pushed up $1 to $1.25 above the normal relationship to soybean oil prices (Figure 2). If blenders believed that there was substantial uncertainty whether the $1 per gallon tax credit would be extended, then it made sense to bid the biodiesel price up by the full amount of the credit in order to maximize usage of the credit. In both 2011 and 2013, the market overshot the competitive market prediction somewhat. In contrast, the biodiesel price in 2016 was only bid up by a maximum of about $0.50 per gallon.
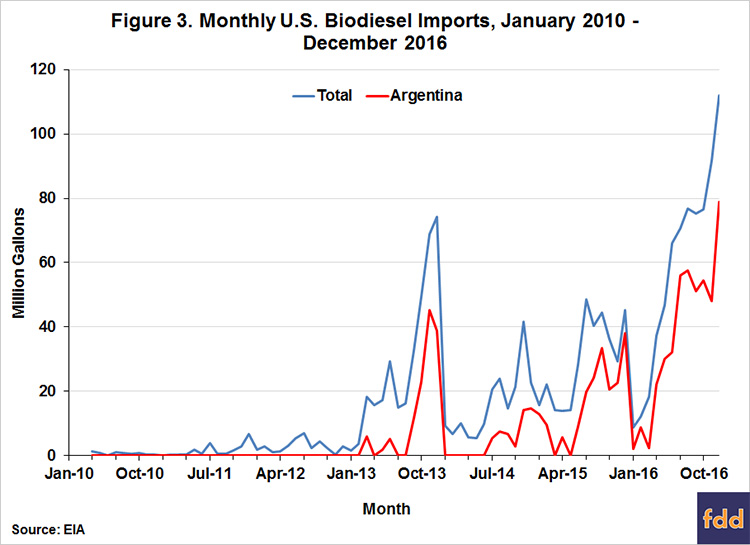
One possible explanation for the smaller spike in biodiesel prices and profits in 2016 (farmdoc daily, July 27, 2016) is that diesel blenders had a much different view about the odds of the tax credit being reinstated in 2017. If blenders believed there was a higher probability that the credit would be extended than in the past, then the incentives for bidding up the price of biodiesel would be lessened. While this may have contributed to the smaller spike in 2016, this is not likely to be the whole story, particularly since the tax credit has yet to be reinstated. In fact, another factor probably was considerably more important. Figure 3 shows monthly biodiesel imports into the U.S. over January 2010 through December 2016. While there was also a notable boom in biodiesel imports in 2013, this pales in comparison to the boom witnessed in 2016. The U.S. imported a total of 693 million gallons of biodiesel in 2016, of which almost two-thirds, or 444 million gallons, came from one country, Argentina. In comparison, U.S. domestic production of biodiesel was 1.566 billion gallons in 2016. It is also interesting to observed timing of the boom in biodiesel imports during 2016. Imports skyrocketed in the second half of the year, precisely the period when biodiesel prices and profits reached their maximum in previous years (2011 and 2013) when the tax credit expired.
It is helpful to aggregate the profit margins over an annual horizon in order to see broader trends in estimated biodiesel production profits. Figure 4 shows total annual (pre-tax) profits net of variable and fixed costs for each calendar year between 2007 and 2016. Profits are presented in terms of both total pre-tax net returns and percent return to equity. The total profit in 2016 was $5.8 million, or 24.7 percent. While this was certainly a welcome return to positive returns for the biodiesel industry, as noted above, profits were much higher in 2011 and 2013. We can use the average net profit for the representative plant to make a rough estimate of the loss for the entire U.S. biodiesel industry in 2016. Assuming all plants in the industry earned a net profit of $0.19 per gallon, then, total biodiesel production (excluding renewable diesel) for the U.S. in 2016 of 1.566 billion gallons implies aggregate industry (pre-tax) profits of $298 million.
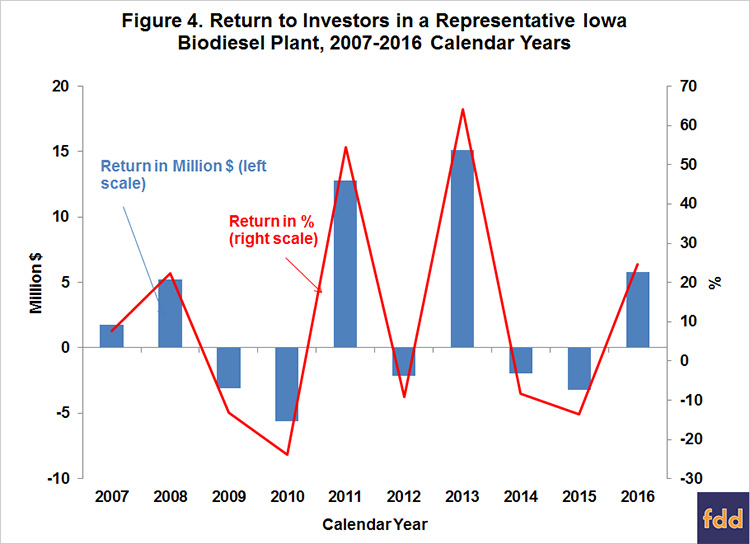
Finally, the percent return to equity holders provides useful information on the attractiveness of investment in biodiesel plants relative to other investments. The average return was 10.5 percent over 2007-2016 and the standard deviation, a measure of risk, was 30.2 percent. By comparison, the average return for the stock market over this period, as measured by the S&P 500, was 8.6 percent and the associated standard deviation was 18.6 percent. The ratio of average return to standard deviation provides one measuring stick of an investment’s return-risk attractiveness, and on this measure the ratio for biodiesel investment, 0.35, is lower than the stock market as a whole, 0.46. The relative riskiness of biodiesel investment is not surprising given that over 80 percent of the positive profits earned by biodiesel plants occurred in only three years (2011, 2013, and 2016).
Implications
Biodiesel production profitability moved back into the black in 2016 for the first time since 2013. Profit after all variable and fixed costs for a representative plant in 2016 is estimated to average $0.19 per gallon. The return to profitability followed the script of previous years, like 2011 and 2013, when the biodiesel tax credit expired at the end of the calendar year. Such spikes make sense because diesel blenders face a binding RFS biodiesel mandate and they can effectively purchase biodiesel at a discount in the current year, due to the tax credit, in order to meet mandates in later years. What is interesting about the 2016 version of this cycle is that it was much smaller than in 2011 and 2013. A surge in biodiesel imports into the U.S. is the most likely explanation for the diminished 2016 spike. In particular, imports skyrocketed in the second half of the year, precisely the period when biodiesel prices and profits reached their maximum in previous years (2011 and 2013) when the tax credit expired. Looking forward to 2017, further developments on the policy front will likely be required to keep the biodiesel industry in the black. The most positive scenario entails conversion of the biodiesel tax credit from a blender to a producer credit, which would effectively limit biodiesel imports to the U.S (farmdoc daily, August 5, 2015). This change, along with an expanding advanced RFS mandate, would likely eliminate the current slack production capacity of the U.S. biodiesel industry, which would likely provide a major boost to profitability.
References
"Annual Returns on Stock, T.Bonds and T.Bills: 1928 - Current." Obtained by Damodaran, A. from the Federal Reserve database in St. Louis (FRED). Last updated January 5, 2017, accessed March 1, 2017. http://pages.stern.nyu.edu/~adamodar/New_Home_Page/datafile/histretSP.html
Irwin, S. "The Profitability of Biodiesel Production in 2016: Feasting on an Expiring Tax Credit?" farmdoc daily (6):141, Department of Agricultural and Consumer Economics, University of Illinois at Urbana-Champaign, July 27, 2016.
Irwin, S. "The Profitability of Biodiesel Production in 2015." farmdoc daily (6):27, Department of Agricultural and Consumer Economics, University of Illinois at Urbana-Champaign, February 11, 2016.
Irwin, S. "Why is the Price of Biodiesel RINs Plummeting?" farmdoc daily (5):166, Department of Agricultural and Consumer Economics, University of Illinois at Urbana-Champaign, September 10, 2015.
Irwin, S. "Implications of Changing the Biodiesel Tax Credit from a Blender to a Producer Credit." farmdoc daily (5):142, Department of Agricultural and Consumer Economics, University of Illinois at Urbana-Champaign, August 5, 2015.
Irwin, S. "The Profitability of Biodiesel Production in 2014." farmdoc daily (5):16, Department of Agricultural and Consumer Economics, University of Illinois at Urbana-Champaign, January 28, 2015.
Irwin, S. "2014: A Tough Year for Biodiesel Producers." farmdoc daily (4):210, Department of Agricultural and Consumer Economics, University of Illinois at Urbana-Champaign, October 30, 2014.
Irwin, S. "Recent Trends in the Profitability of Biodiesel Production." farmdoc daily (4):51, Department of Agricultural and Consumer Economics, University of Illinois at Urbana-Champaign, March 19, 2014.
Disclaimer: We request all readers, electronic media and others follow our citation guidelines when re-posting articles from farmdoc daily. Guidelines are available here. The farmdoc daily website falls under University of Illinois copyright and intellectual property rights. For a detailed statement, please see the University of Illinois Copyright Information and Policies here.