


Why Isn’t the Price of Ethanol RINs Plummeting?
A recent farmdoc daily article (September 10, 2015) highlighted the fact that D4 biodiesel and D6 ethanol RINs prices have followed very different patterns since the EPA issued its long-awaited proposal for the 2014, 2015 and 2016 RFS mandates on May 29, 2015. After release of the proposal, D4 prices increased slightly while D6 prices literally fell off a cliff (Figure 1). Since that time, D6 RINs prices have generally traded in a sideways fashion, falling only $0.04 per gallon since June 5. In contrast, after rising slightly in the days following the announcement, D4 RINs prices have declined at an ever increasing rate, with a total decline since June 5 of about $0.40 per gallon. The net result has been a very curious pattern of a steep drop in the relative price of D6 and D4 RINs and then an equally sharp recovery (Figure 2). More specifically, the ratio of D6 to D4 prices dropped from about 0.90 before the EPA announcement to near 0.45 at the bottom, recovered all the way back to 0.90 in early September, and then has fallen back to around 0.70 in recent days.


Since RINs prices represent the marginal cost of complying with RFS mandates, it is important to understand why any large change in RINs prices occurs. In the farmdoc daily article on September 10, 2015, it was argued that two factors explained the steep drop in D4 biodiesel RINs prices over the summer–declining soybean oil prices and improving chances that the biodiesel tax credit will be reinstated. The purpose of today’s article is to explain why D6 ethanol RINs prices remained relatively stable over the summer while D4 biodiesel RINs prices plummeted. In other words, what has been driving the dramatic changes in the relative price of D6 and D4 RINs? The answer has important implications for the market’s perception of the degree of “push” in the RFS standards moving forward, a topic we have previously investigated in some detail articles (farmdoc daily, June 3, 2015; June 10, 2015; June 17, 2015).
Conceptual Model
We begin by reviewing a conceptual model of ethanol RINs pricing that we have used several times before to understand the “message” from the RINs markets (e.g., farmdoc daily, August 8, 2014; May 28, 2015). The model presented in Figure 3 represents the supply of ethanol producers and demand from gasoline blenders at the wholesale level on an annual basis. Retail demand at the consumer level is implicitly represented by a simple percentage markup of the wholesale demand shown in Figure 3. The first segment of the wholesale demand curve is assumed to be vertical (perfectly inelastic) in order to represent the demand for ethanol as an MTBE replacement. It is vertical since non-ethanol alternatives are assumed to be prohibitively expensive. The second segment of the demand curve is flat (perfectly elastic) up to the E10 blend wall for ethanol prices equal to 110 percent of CBOB gasoline prices. This breakeven point reflects Department of Energy research on the value of ethanol as an octane enhancer in gasoline blends. The third segment of the demand curve is once again vertical, reflecting the E10 blend wall. It also assumed that ethanol prices do not need to be adjusted to reflect the lower energy content of ethanol (about one-third lower) compared to petroleum gasoline. This is based on the argument, admittedly controversial, that ethanol is such a small portion of the blend that the loss of efficiency is not easily discernible by the consumer. The supply of ethanol producers is represented by a standard upward-sloping function that reflects increasing marginal costs as production expands. Note that imports and exports of ethanol are ignored in the model for simplicity. This does not affect the main conclusions drawn from the model.
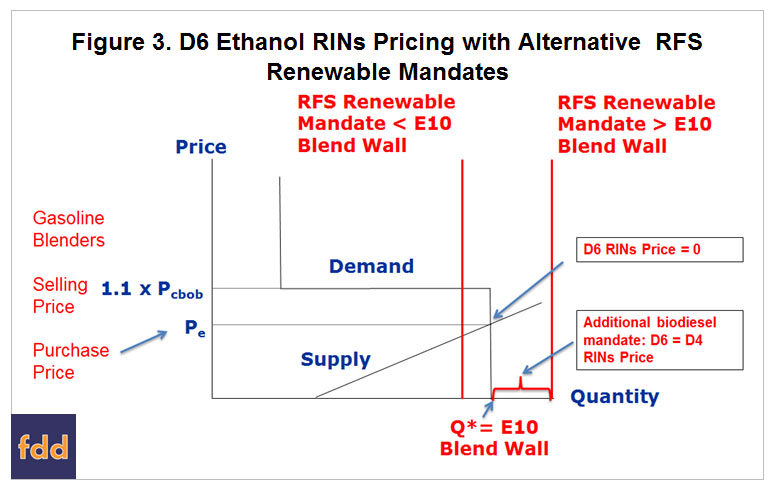
As shown in Figure 3, if the RFS renewable (ethanol) mandate is less than the blend wall, the intersection of market supply and demand results in an equilibrium quantity equal to the E10 blend wall. At this equilibrium point, gasoline blenders make a “normal economic profit” for blending ethanol with gasoline. Since blenders earn a normal return, the model predicts that the price of an ethanol RIN is zero up to the E10 blend wall. The situation is entirely different if the renewable mandate is set above the E10 blend wall. In this case, a “renewable gap” is created that by definition must be filled with something other than E10 ethanol blends. Assuming that higher ethanol blends, such as E15 or E85, cannot be deployed in a cost-effective manner in the short-run (see the farmdoc daily article from February 19, 2015), then the renewable gap effectively becomes additional biodiesel mandate. In this model, the only way to fill the renewable gap and fully comply with the ethanol mandate is by blending biodiesel, which is a higher nested biofuel in terms of RFS compliance. In sum, the model makes two important predictions: 1) if the RFS renewable mandate is less than or equal to E10 blend wall, the D6 price is zero (ignoring time value); and, 2) if the RFS renewable mandate exceeds the E10 blend wall the D6 RINs price switches to being determined by the D4 RINs price. Equivalently, the model predicts that: 1) if the renewable gap is 0 or negative, the ratio between D6 and D4 RINs prices is 0; and 2) if the renewable gap is positive, the ratio between D6 and D4 RINs prices is 1.
While the model presented in Figure 3 provides important insights about ethanol RINs pricing, it ignores two important factors. First, the model only has a one-year horizon. In reality, obligated parties under the RFS have to make compliance decisions in light of mandates over a multi-year horizon, perhaps through the end of the current RFS in 2022. How long of a horizon obligated parties actually consider in their compliance strategies is unknown, but it certainly includes multiple years. Second, the model does not explicitly consider the role of RINs stocks that can be carried over from year-to-year and can be used to fill the renewable gap as needed. The RINs stocks are created through discretionary blending of ethanol (and biodiesel) above RFS mandate levels. As documented by Nick Paulson in a series of farmdoc daily articles in recent years (e.g., July 23, 2015), these carryover RINs stocks can be substantial, and at times have exceeded 2 billion gallons. Figure 4, first presented in a farmdoc daily article on August 8, 2014, illustrates how these two additional factors might combine to impact the pricing of ethanol RINs. The y-axis plots the ratio of D6 to D4 RINs prices. The x-axis plots the ratio of RINs stocks to the renewable mandate gap. The RINs stocks correspond to the initial stocks at the start of obligated parties’ multi-year planning horizon and the renewable gap (ethanol mandate minus E10 blend wall if difference is positive) is the cumulative sum of the renewable gap over the years in the planning horizon. For simplicity, additions to the stock of RINs over the planning horizon are not considered.
The two extremes in Figure 4 are straightforward to explain. If the size of the cumulative renewable gap is large relative to the size of RINs stocks, the ratio on the x-axis will be small, reflecting the fact that obligated parties will rapidly use up the stock of RINs to fill the renewable gap. After the stock of RINs is used up the situation resembles the scenario in Figure 3 where the renewable mandate exceeds the E10 blend wall. That is, obligated parties have to incentivize production of biodiesel in order to generate the additional D4 RINs needed to fill in the rest of the renewable gap over the planning horizon. The end result is that obligated parties rationally bid up the price of D6 RINs close to the level of D4 RINs in expectation of quickly using up the stock of RINs. This pushes the RINs price ratio on the y-axis towards one. At the other extreme, if the size of the cumulative renewable gap is small relative to the stock of RINs, the ratio on the x-axis will be large, and obligated parties have on hand sufficient RINs to fill the renewable gap for a number of years, perhaps the entire length of the planning horizon. If this is the case, than the situation resembles the scenario in Figure 3 where the renewable mandate is less than the E10 blend wall. Since the price of a D6 RINs is zero in this scenario, obligated parties will not be willing to bid anything more than a small amount for D6 RINs and the RINs price ratio on the y-axis approaches zero.

Outcomes between the two extremes in Figure 4 are less certain, but the proposed convex shape is at least plausible. How much “bend” the curve should have is certainly up for debate and will depend on a range of factors, such as the length of the planning horizon, the weight that obligated parties put on current versus future obligations, and the level of the E10 blend wall at different points in the planning horizon.
Explaining Recent D6 RINs Prices
With the conceptual background provided in the previous section, we can return to the central question of this article: What has been driving the dramatic changes in the relative price of D6 and D4 RINs since the release of the EPA’s preliminary RFS proposal on May 29, 2015? As shown earlier in Figure 2, the ratio of D6 to D4 prices dropped from about 0.90 before the EPA announcement to near 0.45 at the bottom, recovered all the way back to 0.90 in early September, and then fell back to around 0.70 in recent days. We argue that the key to understanding the large fluctuations in the relative price of D6 and D4 RINs is market expectations about how soon the stock of RINs will be exhausted.
Inferring how quickly the market thinks that RINs stocks will be exhausted is not a simple process. Our approach is to formulate four basic scenarios for the path of the renewable gap over 2014-2022 and then determine how quickly the available stock of RINs would be extinguished under each scenario. The basic idea is to calculate the magnitude of the renewable gap each year over 2014-2022 for a particular RFS policy trajectory and assumptions about fuel market conditions. This is the same approach we have used in several previous farmdoc daily articles on implementation of the RFS (e.g., February 19, 2015; June 3, 2015; June 10, 2015; June 17, 2015). Note that the “push” above the E10 blend wall discussed in these articles is identical to the renewable gap as defined here. A summary of the four scenarios follows:
EPA: Exactly the same assumptions for the renewable mandate and gasoline and diesel consumption for 2014-2016 as found in the EPA’s preliminary RFS proposal from May 29, 2015. The specific levels of the renewable mandate for 2014, 2015, and 2016 in the proposal are 13.25, 13.4, and 14.0 billion gallons, respectively. After 2016, the renewable mandate is assumed to continue to increase, reaching the statutory maximum of 15.0 billion gallons in 2021. Gasoline and diesel use is assumed to plateau after 2016.
RINs Market: All assumptions are the same as the EPA scenario except gasoline and diesel use increases three percent in 2015, one percent in 2016, and one-half percent in 2017. Gasoline and diesel use then reaches a plateau after 2017. Note that the levels of the renewable mandate for this scenario are identical to those assumed for the EPA scenario.
Irwin and Good: In this scenario, gasoline and diesel use are the same as in the RINs Market scenario. That is, gasoline and diesel use increase three percent in 2015, one percent in 2016, and one-half percent in 2017. However, rather than assuming fixed renewable volume levels as gasoline and diesel use increase, this scenario assumes that the EPA targets the same fractional mandates as contained in the preliminary proposal. In addition, renewable mandates are adjusted to reflect corrections to the EPA’s methodology that accounts for ethanol exports. The specific levels of the renewable mandate for 2014, 2015, and 2016 under this scenario are 13.6, 13.7, and 14.3 billion gallons, respectively. After 2016, the renewable mandate is assumed to continue to increase, reaching the statutory maximum of 15.0 billion gallons in 2020.
Statutory: Once again, gasoline and diesel use are assumed to increase three percent in 2015, one percent in 2016, and one-half percent in 2017. The renewable mandate is set at the statutory level of 14.4 billion gallons for 2014 and 15.0 billion gallons in 2015 and thereafter.
Complete details of all assumptions and calculations of the renewable gap for each scenario can be found in Appendix Tables 1-4.
The cumulative renewable gap for each year over 2014-2022 under the four scenarios is presented in Figure 5, along with an estimate of the available stock of RINs on January 1, 2015. For example, under the EPA scenario the renewable gap starts at zero in 2014, rises to 0.873 billion gallons in 2016, and then tops out at 9.161 billion gallons in 2022. Not surprisingly, the cumulative renewable gap is the smallest through 2022 for what we have called the RINs market scenario. The gap for this scenario does not exceed 2 billion gallons until 2020 because the assumed growth in gasoline and diesel use expands E10 consumption, which in turn soaks up much of the increase in the renewable mandate over time. At the other end of the spectrum the renewable gap is the largest for statutory scenario, especially before 2020. Under this scenario, the renewable gap starts at 1.061 billion gallons in 2014, rises to 3.55 billion gallons in 2016, and then tops out at 10.588 billion gallons in 2022. The cumulative renewable gap for the other two scenarios–the RINs Market and Irwin and Good–falls between these two extremes.

Figure 5 also contains an estimate of the total stock of D4, D5, and D6 RINs available on January 1, 2015, which is 2.20 billion gallons. We are grateful to Nick Paulson for his assistance in developing this updated estimate. It incorporates adjustments to his previous estimates (farmdoc daily, July 23, 2015) to account for undenatured ethanol exports that do not generate RIN credits. The magnitude of the cumulative renewable gaps presented in Figure 5, along with the estimate of the available stock of RINs on January 1, 2015, can be used to estimate the date that the cumulative renewable gap will exhaust the stock of RINs under each of the four scenarios described above. The projected dates when RINs stocks will be exhausted are summarized in Table 1. For each scenario the “exhaustion date” is calculated based on the stock of D6 RINs only and on the stock of D4, D5, and D6 RINS. The latter is relevant since the “higher-ordered” D4 and D5 advanced biofuel RINs can be used to comply with the renewable mandate if necessary. This results in eight different dates for possible exhaustion of the RINs stock. The calculations assume a linear progression of renewable gaps within a year. The earliest dates of May 15, 2015 and October 15, 2015 are under the scenario that enforced the statutory mandates, which cannot literally occur because final standards for 2014-2016 will not be announced by these dates. However, these dates do clearly indicate that a future court case that overturns the EPA’s current proposal and returns the renewable mandate to statutory levels would cause the stock of RINs to literally evaporate overnight. Notice that the exhaustion dates for the RINs Market scenario are August 2019 and March 2020, or four to four-and-a-half years from the current date. Exhaustion dates are around two years from now for the EPA scenario and three years from now for the Irwin and Good scenario.

With the estimates of exhaustion dates in hand for the four scenarios we can unravel some of the mystery surrounding the recent large changes in the relative prices of D6 ethanol and D4 biodiesel RINs. Recall that the conceptual framework presented in Figure 4 predicts that the relative price of D6 and D4 RINs should be a function of the ratio of RINs stocks to the magnitude of the cumulative renewable gap. Stated another way, the D6/D4 price ratio should be a function of how quickly RINs stocks are expected to be exhausted by the renewable gap. Expectations that stocks will be exhausted soon should result in a relatively high price ratio and vice versa. Since the D6/D4 price ratio before the EPA announcement was around 0.90 (Figure 2), one can infer that market participants expected RINs stocks to be exhausted “sooner” rather than “later.” The only one of the four scenarios associated with a relatively quick exhaustion of the RINs stocks is the statutory scenario. While market participants did not necessarily expect the EPA to return immediately to statutory renewable mandate levels, the high price ratios indicate they expected this to happen in the near future, perhaps as early as 2016 (farmdoc daily, May 28, 2015). The plunge in the D6/D4 price ratio after release of the EPA proposal below 0.50 clearly suggests that market participants initially viewed the proposed renewable volumes as pushing the exhaustion date for RINs stocks well off into the future. This is consistent with the calculated exhaustion dates for the RINs market scenario that are at least four years into the future. The rapid recovery of the D6/D4 price ratio back above 0.75 over the summer is not as easily explained. We believe the best explanation is that market participants initially believed that the EPA would keep renewable mandate volumes fixed in the final rules for 2014-2015 even if projections for gasoline and diesel use increased by the time the final rules are released (by the end of November 2015), but then expectations were altered as more evidence emerged that the EPA might target the fractional mandates in the initial proposal rather than fixed volume mandates (farmdoc daily, June 10, 2015). This altered expectation is most consistent with exhaustion dates for the EPA and Irwin and Good scenarios.
Implications
The price of D6 ethanol RINs was relatively stable over the summer, while D4 biodiesel RINs prices plummeted. This raises the question of what has been driving the dramatic changes in the relative price of D6 and D4 RINs in recent months. We argue that the key to understanding the large fluctuations in the relative price of D6 and D4 RINs is market expectations about how soon the stock of RINs will be exhausted. Stated another way, the D6/D4 price ratio should be a function of how quickly RINs stocks are expected to be exhausted by the renewable gap, which is simply the cumulative positive difference between the renewable (ethanol) mandate and the E10 blend wall. Before the EPA released its preliminary proposal for 2014-2016 RFS standards on May 29, 2015, the ratio of D6 and D4 RINS prices was in the vicinity of 0.90. This indicated market participants expected the EPA to return to statutory renewable mandate levels in the near future, perhaps as early as 2016, which would quickly exhaust the stock of RINs. The plunge in the D6/D4 price ratio below 0.50 after release of the EPA proposal suggests market participants initially viewed the proposed renewable volumes as pushing the exhaustion date for RINs stocks well off into the future. The recovery of the D6/D4 price ratio back above 0.75 over the summer may be related to some uncertainty or confusion about how the RFS mandates announced by EPA would be enforced. Whether the mandates would be enforced based strictly on volumetric requirements or based on fractional blending requirements could influence the size of the renewable gap and how soon the stock of RINs is exhausted.
References
Department of Energy. "Department of Energy Analyses in Support of the EPA Evaluation of Waivers of the Renewable Fuel Standard." November 2012.http://ethanolrfa.3cdn.net/1c8f40b533c12645b1_ubm6i6l9b.pdf
Environmental Protection Agency. "Renewable Fuel Standard Program: Standards for 2014, 2015, and 2016 and Biomass Based Diesel Volume for 2017; Proposed Rule." Federal Register 80(111), June 10, 2015. http://www.gpo.gov/fdsys/pkg/FR-2015-06-10/pdf/2015-13956.pdf
Gasoline gallon equivalent. In Wikipedia. Last modified on September 7, 2015, at 09:33, and retrieved September 23, 2015, from https://en.wikipedia.org/wiki/Gasoline_gallon_equivalent
Irwin, S. "Why is the Price of Biodiesel RINs Plummeting?" farmdoc daily (5):166, Department of Agricultural and Consumer Economics, University of Illinois at Urbana-Champaign, September 10, 2015.
Irwin, S. "Clues from the RINs Market about the EPA's RVO Proposals for 2014, 2015, and 2016." farmdoc daily (5):98, Department of Agricultural and Consumer Economics, University of Illinois at Urbana-Champaign, May 28, 2015.
Irwin, S. "Rolling Back the Write Down of the Renewable Mandate for 2014: The RINs Market Rings the Bell Again." farmdoc daily(4):148, Department of Agricultural and Consumer Economics, University of Illinois, August 8, 2014.
Irwin, S., and D. Good. "Implementing the RFS with a 'Push' Strategy: What Happens after 2016?" farmdoc daily (5):112, Department of Agricultural and Consumer Economics, University of Illinois at Urbana-Champaign, June 17, 2015.
Irwin, S. and D. Good. "Does it Matter Whether the EPA Targets Volumetric or Fractional RFS Standards?" farmdoc daily (5):107, Department of Agricultural and Consumer Economics, University of Illinois at Urbana-Champaign, June 10, 2015.
Irwin, S. and D. Good "The EPA's Proposed Ethanol Mandates for 2014, 2015, and 2016: Is There a 'Push' or Not? " farmdoc daily(5):102, Department of Agricultural and Consumer Economics, University of Illinois at Urbana-Champaign, June 3, 2015.
Irwin, S., and D. Good. "What if the EPA Implements RFS Mandates for Renewable Fuels at Statutory Levels?" farmdoc daily (5):31, Department of Agricultural and Consumer Economics, University of Illinois at Urbana-Champaign, February 19, 2015.
Paulson, N. "2015 Mid-Year RIN Update." farmdoc daily (5):134, Department of Agricultural and Consumer Economics, University of Illinois at Urbana-Champaign, July 23, 2015.
Appendices


Disclaimer: We request all readers, electronic media and others follow our citation guidelines when re-posting articles from farmdoc daily. Guidelines are available here. The farmdoc daily website falls under University of Illinois copyright and intellectual property rights. For a detailed statement, please see the University of Illinois Copyright Information and Policies here.