


Demand Destruction 2.0 for Biodiesel and Renewable Diesel?
Two recent farmdoc daily articles (February 5, 2025; February 12, 2025) examined the impact of small refinery exemptions (SREs) under the U.S. Renewable Fuel Standard (RFS) on the demand for ethanol and biomass-based diesel (BBD). The aggregate blend rate for ethanol and BBD in the U.S. was examined during the period of heaviest SRE activity under the first Trump Administration—December 2017 through January 2020. No evidence was found that the blend rate for ethanol fell systematically during this period, while the BBD blend rate fell precipitously. We concluded that SREs did not cause a reduction in the physical demand for ethanol but wreaked considerable destruction on the demand for BBD. A limitation of the work on BBD demand is that it did not break out demand impacts separately for FAME biodiesel and renewable diesel. These are by far the two largest components of BBD demand. Hence, the purpose of this article is to investigate the magnitude of FAME biodiesel and renewable diesel demand destruction due to SREs during the first Trump Administration in order to better understand potential impacts if the second Trump Administration follows suit. This is not merely an academic exercise, as 139 SRE petitions for the 2016 through 2025 compliance years are currently pending before the U.S. Environmental Protection Agency (EPA), which is responsible for administering the RFS program.
Analysis
The RFS was created under the Energy Policy Act of 2005 and was later modified and expanded under The Energy Independence and Security Act of 2007 (farmdoc daily, May 17, 2023). The 2005 version of the program is known as “RFS1” and the 2007 version as “RFS2.” RFS1 included a provision to exempt small refineries (fewer than 75,000 barrels of average aggregate daily crude oil throughput) from the specified biofuel mandates based upon a finding of a disproportionate economic hardship for the small refinery (or refiner), and this provision was not changed in RFS2. The implementation of small refinery exemptions (SREs) has changed substantially over time. Initially, RFS1 provided a statutory blanket exemption for all small refiners through 2010. In 2011, EPA temporarily extended the blanket exemption through 2012 in response to demands from Congress for a reassessment of the impacts on small refineries (farmdoc daily, December 6, 2017). From 2013 through 2016, the Obama Administration awarded only a few SREs. This policy was reversed in 2017 by the first Trump Administration, with the EPA granting a total of 85 SREs for the 2016-2018 compliance years representing nearly 40 billion gallons of exempted gasoline and diesel volumes (farmdoc daily, September 19, 2019).
The retroactive manner in which the SREs were implemented without reallocation under the first Trump Administration effectively reduced the size of all mandates, including the BBD mandate. For example, the SREs awarded for 2017 reduced the BBD mandate from 2.1 billion gallons to 1.92 billion gallons (farmdoc daily, July 12, 2018). Additional SREs were awarded for the 2019 compliance year and expected SREs for the 2020 compliance year were part of the final EPA rulemaking for that year. However, a Tenth Circuit Court of Appeals decision in late January 2020 vacated most of the SREs granted in previous years and remanded the matter back to the EPA for further proceedings consistent with the opinion (farmdoc daily, March 12, 2020). The January 2020 decision marked the effective end of SREs having a major impact on the implementation of RFS mandates in the first Trump and Biden Administrations.
A series of earlier farmdoc daily articles (September 13, 2018; December 13, 2018; January 16, 2019: March 14, 2019) examined the impact of SREs on biofuel markets and found: i) little or no evidence of demand destruction for ethanol, and ii) substantial evidence of demand destruction for BBD. However, these articles were published before January 2020, and therefore did not have complete data for the period when SREs potentially had their greatest market impact.
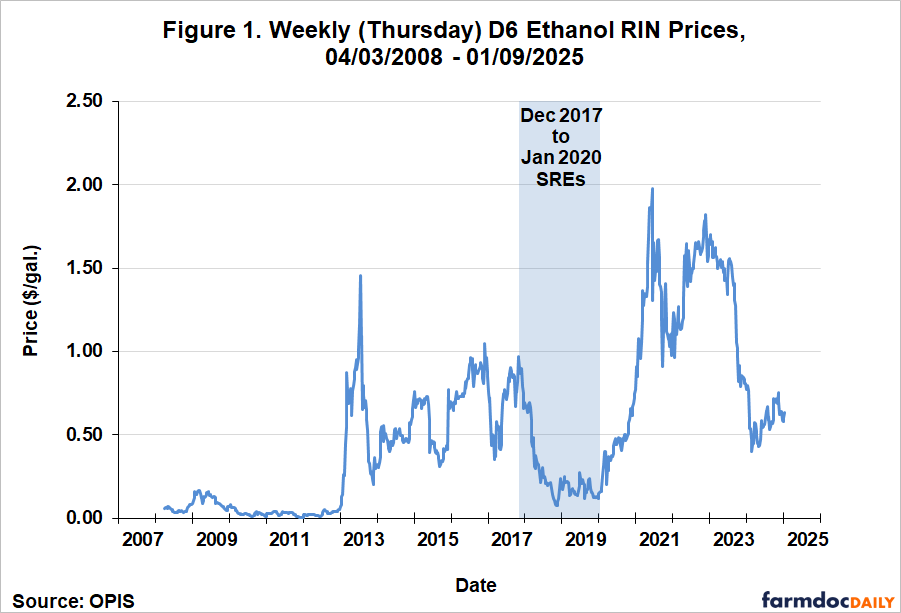
The first step of the present analysis is to define the period of greatest SRE impact during the first Trump Administration. The argument made at the time by many in the biofuel industry was that SREs impacted demand through incentives provided by RIN prices. (See the farmdoc daily article from May 24, 2023 for an overview of the RFS RIN compliance system.) Based on this logic, the relevant time window should start when SREs drove down RIN prices sharply. In our recent article on ethanol demand destruction (farmdoc daily, February 5, 2025), D6 ethanol RIN prices were used to date the beginning of the SRE period. Figure 1 presents weekly D6 ethanol RIN prices from April 3, 2008 through January 9, 2025. The figure shows that D6 prices peaked at just under $1.00 per gallon in late October 2017, and then started to plummet in December with the announcement of SREs. This suggests the impact of SREs on the physical demand for ethanol, if any, should have started around December 2017. Figure 2 shows weekly D4 BBD RIN prices from September 3, 2009 through January 9, 2025, and these prices also suggest that the impact of SREs on the physical demand for BBD should have started around the same time, December 2017. Note that this is the same starting date we used in our earlier analyses of the impact of SREs on biofuel demand (farmdoc daily, September 13, 2018; December 13, 2018; January 16, 2019: March 14, 2019). We can date the end of the most active SRE period to January 2020 based on the court case discussed above. Both D4 and D6 prices began to recover shortly after the January 2020 court decision was announced and ultimately reached highs of nearly $2.00 per gallon in June 2021.

The next step of the analysis is to investigate the potential impact of SREs on physical FAME biodiesel and renewable diesel consumption. We do not examine the level of consumption because it varies over time due to seasonal factors as well as variation in aggregate income, interest rates, and other macroeconomic factors. Since diesel consumption is driven by many of the same factors, we remove the effect of these factors by comparing the consumption of biodiesel and renewable diesel relative to the consumption of diesel. By dividing FAME biodiesel and renewable diesel consumption by diesel consumption, we obtain a measure of use that is largely independent of other factors that drive consumption. We employ the most inclusive measures of physical biodiesel, renewable diesel, and diesel consumption. Rather than being a direct survey estimate, biofuels consumption is implied based on the FAME biodiesel and renewable diesel balance sheets as follows:
Domestic Use = Beginning Stocks + Production + Imports – Exports – Ending Stocks.
All data is published by the EIA (Economic Information Agency) of the U.S. Department of Energy except renewable diesel exports, which is estimated based on D4 RIN retirements (1.7 equivalent) reported by the EPA. Diesel consumption is implied in a similar manner by the EIA and reported as product supplied of distillate fuel oil.
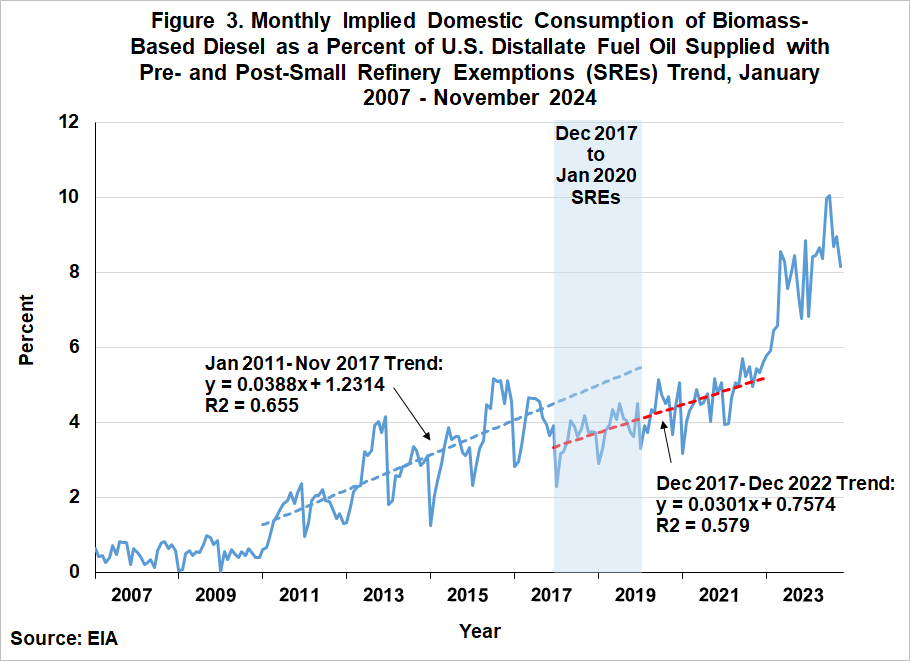
For perspective, it is helpful to review the evidence in our most recent farmdoc daily article (February 12, 2025) on the blend rate for BBD. Figure 3 presents the monthly implied BBD blend rate over January 2007 through November 2024. The linear trend line fit to the pre-SRE period of January 2011 through November 2017 shows a sharp upward trend, with the BBD blend rate growing about half-a-percent per year. The downward shift in the trend with the start of the SRE period was unmistakable. The blue dashed line in the SRE period is a projection of the pre-SRE period trend and serves as an estimate of what the blend rate would have been without the SREs. On average, the difference between the blue dashed line and the red-dashed line during the SRE period is 1.3 percentage points. The blending rate declines can be easily converted into physical gallons by multiplying the decline in blending rates for a month by total diesel consumption for that month. Doing this for each month and summing across December 2017 through January 2020 results in a total estimated BBD demand decline of 1.73 billion gallons due to the SREs.
We now proceed to decompose the impacts of SREs on BBD into separate impacts on FAME biodiesel and renewable diesel. Figure 4 shows the monthly implied FAME biodiesel blend rate over January 2007 through November 2024. The linear trend line fit to the pre-SRE period of January 2011 through November 2017 shows a similar pattern as the BBD blend rate in Figure 4, which is not surprising because biodiesel represented the bulk of BBD during this period. Once again, the downward shift in the FAME trend with the start of the SRE period was large and statistically significant. The blue dashed line in the SRE period is a projection of the pre-SRE period trend and serves as an estimate of what the blend rate would have been without the SREs. On average, the difference between the blue dashed line and the red-dashed line during the SRE period is 1.1 percentage points. Converting into physical gallons each month and summing across December 2017 through January 2020 results in a total estimated FAME biodiesel demand decline of 1.53 billion gallons due to the SREs.
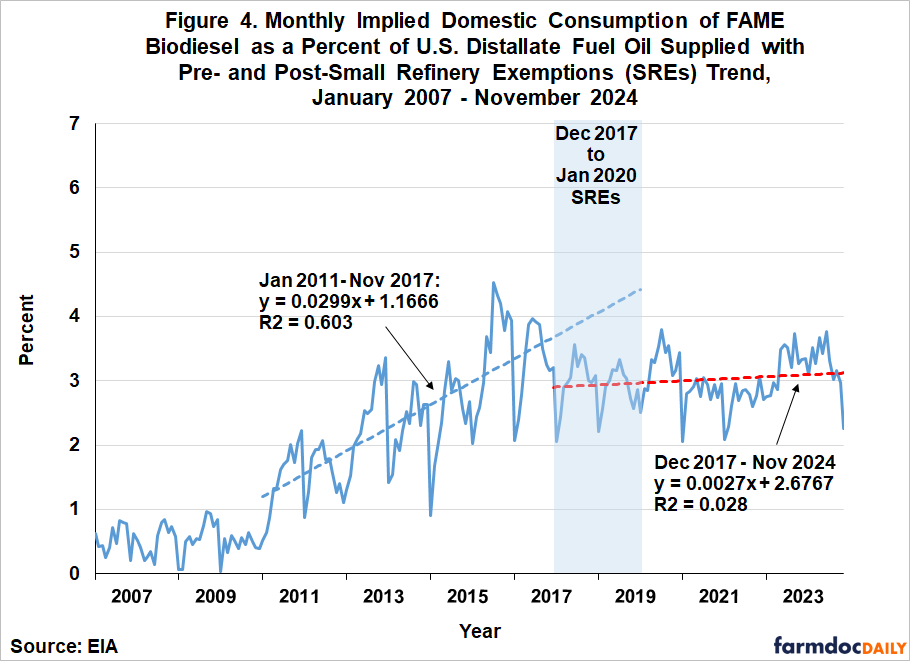
One of the most striking results in Figure 4 is what happened during the post-SRE period. Or more accurately, what did not happen. For all practical purposes, the average biodiesel blend rate dropped to about three percent at the beginning of the SRE period and it has been stuck there ever since. The difference in the trends pre- and post-SREs could not be starker. Before the SRE period, FAME biodiesel was in the middle of a major boom, which ended very abruptly, and the industry has never recovered.
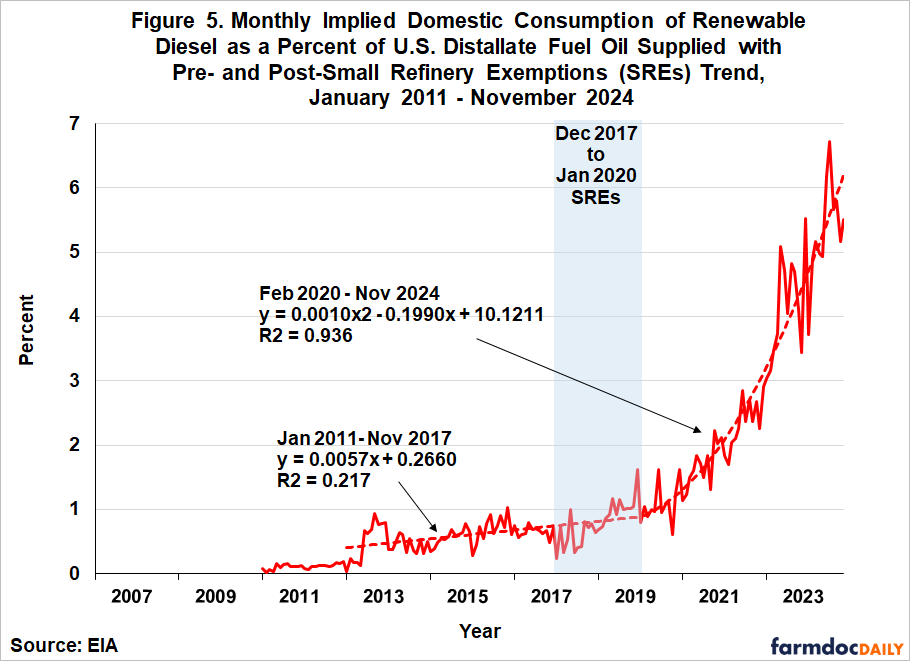
For comparison, Figure 5 presents the monthly implied renewable diesel blend rate over January 2007 through November 2024. The contrast with the pattern for FAME biodiesel is obvious. Renewable diesel blending started to grow noticeably in 2013 and this continued at a moderate pace through the end of the pre-SRE period. There was a drop off in the blend rate through the first half of the SRE period, but this was offset by gains during the second half. Overall, the trend during the pre-SRE and SRE periods did not differ. So, the net loss in the renewable diesel blend rate for the entire SRE period was minimal at only 30 million gallons. Shortly after the end of the SRE period, the renewable diesel blend rate began a meteoric rise from around one percent to a peak of nearly seven percent. This represents growth in the blend rate of about one percentage point per year. The fortunes of the renewable diesel and FAME biodiesel industries in the post-SRE period could not be more different.
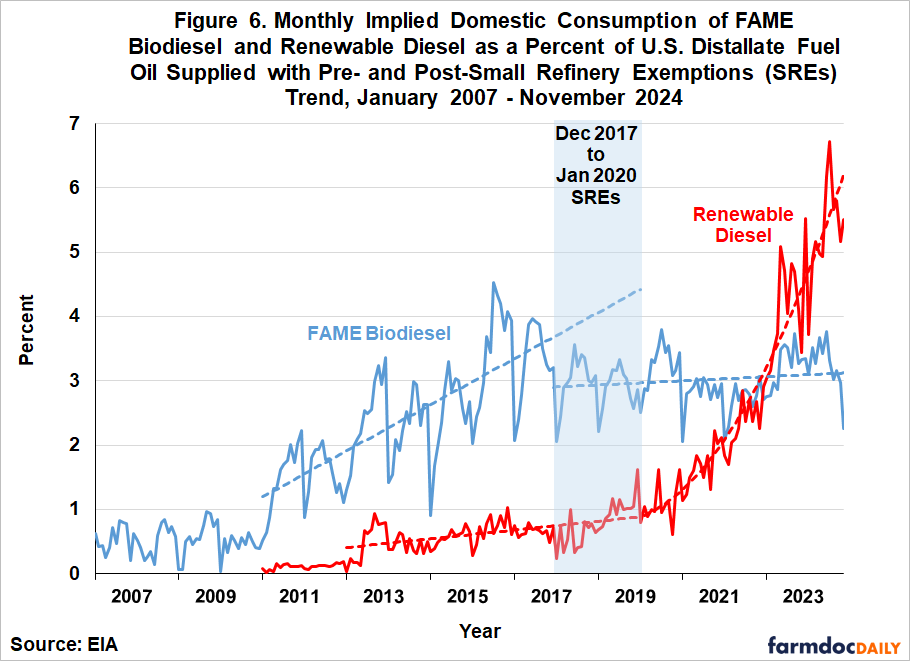
It is helpful to plot the FAME biodiesel and renewable diesel blend rates on the same chart, as we do in Figure 6. The chart highlights the fact that nearly all the demand destruction from SREs fell on biodiesel and almost none on renewable diesel. This is not a complete surprise because biodiesel was a much larger component of BBD at the time than renewable diesel. At the same time, renewable diesel did not absorb its proportional share of the demand destruction by SREs. We previously estimated that the lost revenue for BBD producers during the SRE period was $6.7 billion dollars (farmdoc daily, February 12, 2025). Virtually all this economic loss fell on FAME biodiesel producers and almost none on renewable diesel producers.
The bottom-line is that biodiesel was stopped in its tracks by the SREs and all the growth in BBD demand during the post-SRE period accrued to renewable diesel. In this competitive battle for BBD market share, renewable diesel had several advantages over FAME biodiesel. First, renewable diesel is a “drop-in” replacement for petroleum diesel (farmdoc daily, February 8, 2023). In other words, renewable diesel does not need to be blended with petroleum diesel for it to be used as a “spec” fuel in modern diesel engines. The drop-in nature of renewable diesel is a significant advantage over FAME biodiesel, which typically is limited to blends of 5 to 20 percent. Second, renewable diesel generally earns 1.7 RINs per gallon compared to 1.5 for FAME biodiesel. If D4 RIN prices are $1 per ethanol-equivalent gallon, this translates into $0.20 per physical gallon more RIN credits for renewable diesel compared to FAME, or a 13 percent advantage. Third, renewable diesel generally earns more credits per gallon than FAME biodiesel under the Low Carbon Fuel Standards (LCFS) in California, Oregon, and Washington. The higher credits can also be earned on much larger quantities of renewable diesel because of the drop-in nature of the fuel, which creates a powerful economic incentive. Fourth, renewable diesel plants generally are much larger than FAME biodiesel plants, reflecting the economies of size that are inherent in the petroleum refining infrastructure and technology used in renewable diesel production (farmdoc daily, March 8, 2023).
Implications
The issue of small refinery exemptions (SREs) once again looms large for the U.S biofuels industry. While it is not known at this time how the new Trump Administration will approach the awarding of SREs under the U.S. Renewable Fuel Standard (RFS), what we do know is that the number of petitions for SREs has risen dramatically in recent months. At the present time, 139 SRE petitions for the 2016 through 2025 compliance years are pending before the U.S. Environmental Protection Agency (EPA). It is possible that the new Trump Administration will follow the playbook from the first Administration and effectively write down future mandates through the retroactive awarding of large numbers of the pending SRE petitions. The previous episode with SREs during the first Trump Administration provides a valuable test case regarding the potential for “demand destruction” if this policy is repeated.
We examined the aggregate blend rate for FAME biodiesel and renewable diesel in the U.S. during the period of heaviest SRE activity in the first Trump Administration—December 2017 through January 2020—and found strong evidence that the blend rate fell swiftly and systematically during this period for biodiesel but not renewable diesel. On average, the FAME blend rate during the SRE period fell by 1.1 percentage points. In volume terms, total FAME biodiesel demand declined 1.53 billion gallons due to the SREs. If this were not enough, the results showed that the biodiesel blend rate never recovered after the SRE episode. The average FAME biodiesel blend rate dropped to about three percent at the beginning of the SRE period and it has been stuck there ever since. In contrast, the net loss in renewable diesel demand for the entire SRE period was minimal at only 30 million gallons. Shortly after the end of the SRE period, the renewable diesel blend rate began a meteoric rise from around one percent to a peak of nearly seven percent. The growth in renewable diesel reflected several inherent competitive advantages over FAME biodiesel.
In sum, the evidence points towards FAME biodiesel once again absorbing the brunt of any future SREs that are not reallocated under the RFS mandates. This historical tendency may be amplified by the interaction between the RFS and state Low Carbon Fuel Standard (LCFS) programs in California, Washington, and Oregon. If D4 biomass-based diesel RIN prices under the RFS are driven down by SREs, LCFS credit prices may increase to continue incentivizing the generation of biomass-based diesel credits for the state programs. Since renewable diesel generally earns more LCFS credits than FAME biodiesel, the offsetting increase in credit prices would provide more of a safety-net for renewable diesel than biodiesel. The complicated interaction between the RFS and state level programs is an important topic for future analysis.
References
Coppess, J. and S. Irwin. "EPA and the Small Refinery Exemption Issue in the Renewable Fuel Standard Mandates." farmdoc daily (10):46, Department of Agricultural and Consumer Economics, University of Illinois at Urbana-Champaign, March 12, 2020.
Coppess, J. and S. Irwin. "EPA 2019 RFS Proposed Rulemaking: What You See Is Not What You Get." farmdoc daily (8):128, Department of Agricultural and Consumer Economics, University of Illinois at Urbana-Champaign, July 12, 2018.
Coppess, J. and S. Irwin. "Another Wrinkle in the RFS: The Small Refinery Exemption." farmdoc daily (7):224, Department of Agricultural and Consumer Economics, University of Illinois at Urbana-Champaign, December 6, 2017.
Gerveni, M., T. Hubbs and S. Irwin. "Overview of the RIN Compliance System and Pricing of RINs for the U.S. Renewable Fuel Standard." farmdoc daily (13):95, Department of Agricultural and Consumer Economics, University of Illinois at Urbana-Champaign, May 24, 2023.
Gerveni, M., T. Hubbs and S. Irwin. "Overview of the U.S. Renewable Fuel Standard." farmdoc daily (13):90, Department of Agricultural and Consumer Economics, University of Illinois at Urbana-Champaign, May 17, 2023.
Gerveni, M., T. Hubbs and S. Irwin. "Overview of the Production Capacity of U.S. Renewable Diesel Plants through December 2022." farmdoc daily (13):42, Department of Agricultural and Consumer Economics, University of Illinois at Urbana-Champaign, March 8, 2023.
Gerveni, M., T. Hubbs and S. Irwin. "Biodiesel and Renewable Diesel: What’s the Difference?" farmdoc daily (13):22, Department of Agricultural and Consumer Economics, University of Illinois at Urbana-Champaign, February 8, 2023.
Gerveni, M., T. Hubbs, S. Irwin and S. Ramsey. "Revisiting the RIN Cliff." farmdoc daily (15):10, Department of Agricultural and Consumer Economics, University of Illinois at Urbana-Champaign, January 15, 2025.
Gerveni, M. and S. Irwin. "Policy Priorities for Biomass-Based Diesel." farmdoc daily (15):17, Department of Agricultural and Consumer Economics, University of Illinois at Urbana-Champaign, January 29, 2025.
Gerveni, M. and S. Irwin. "Policy Priorities for Biomass-Based Diesel." farmdoc daily (15):17, Department of Agricultural and Consumer Economics, University of Illinois at Urbana-Champaign, January 29, 2025.
Irwin, S. "Biomass-Based Diesel Demand Destruction 2.0?" farmdoc daily (15):27, Department of Agricultural and Consumer Economics, University of Illinois at Urbana-Champaign, February 12, 2025.
Irwin, S. "Ethanol Demand Destruction 2.0?" farmdoc daily (15):22, Department of Agricultural and Consumer Economics, University of Illinois at Urbana-Champaign, February 5, 2025.
Irwin, S. "Clearing the Logjam on the RFS and SREs: A Simple Proposal." farmdoc daily (9):175, Department of Agricultural and Consumer Economics, University of Illinois at Urbana-Champaign, September 19, 2019.
Irwin, S. "Small Refinery Exemptions and Biomass-Based Diesel Demand Destruction." farmdoc daily (9):45, Department of Agricultural and Consumer Economics, University of Illinois at Urbana-Champaign, March 14, 2019.
Irwin, S. "Small Refinery Exemptions and E85 Demand Destruction." farmdoc daily (9):8, Department of Agricultural and Consumer Economics, University of Illinois at Urbana-Champaign, January 16, 2019.
Irwin, S. "More on Small Refinery Exemptions and Ethanol Demand Destruction." farmdoc daily (8):228, Department of Agricultural and Consumer Economics, University of Illinois at Urbana-Champaign, December 13, 2018.
Irwin, S. "Small Refinery Exemptions and Ethanol Demand Destruction." farmdoc daily (8):170, Department of Agricultural and Consumer Economics, University of Illinois at Urbana-Champaign, September 13, 2018.
Irwin, S. and D. Good. "Revisiting the Estimation of Biomass-Based Diesel Supply Curves." farmdoc daily (7):135, Department of Agricultural and Consumer Economics, University of Illinois at Urbana-Champaign, July 26, 2017.
Disclaimer: We request all readers, electronic media and others follow our citation guidelines when re-posting articles from farmdoc daily. Guidelines are available here. The farmdoc daily website falls under University of Illinois copyright and intellectual property rights. For a detailed statement, please see the University of Illinois Copyright Information and Policies here.